1. What was the accounts receivable turnover for year 8?
2. Year 9 accounts receivable turnover is projected to the same as year 8. What is the projection for average accounts receivable?
3. What is the projection for accounts receivable for the end of the year for year 9?
4. Would cash be generated by accounts receivable or needed to fund accounts receivable? And, by how much?
5. If accounts payable is projected to remain the same proportion to sales revenue as year 8, what is the projection for accounts payable for the end year 9?
6. Would cash be generated by accounts payable or needed to fund accounts payable? And, by how much?
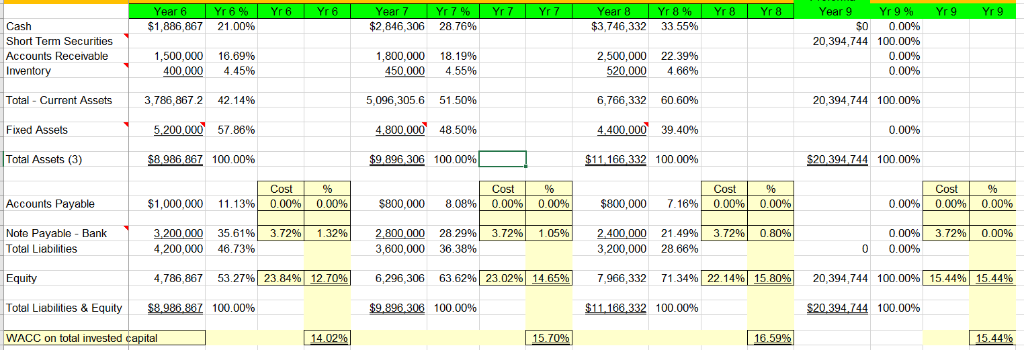
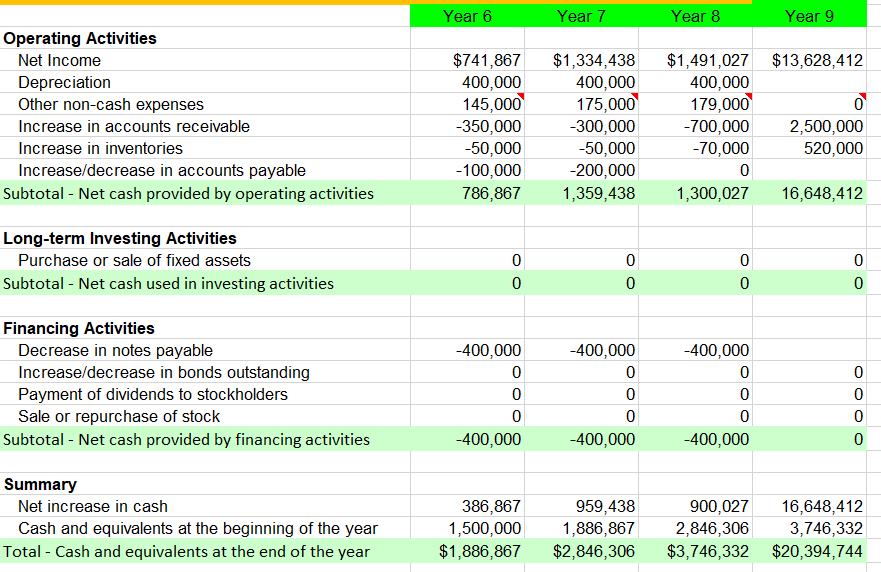
ear Cash Short Term Securities Accounts Recervable Inventory $1,886 867 21.00% $2,846 306 28 76% $3,746,332 3355% $0 20,394,744 00096 100.00% 0.00% 0.00% 1,500,000 16.69% 1.800.000 18,19% 2,500,000 22.39% 520,000 466% 400.000 4.45% 3,786,867.2 42.14% 5200000 57.86% $8986 867 100 00% 450.000 4.55% 5096.3056 51.50% 4,800,000" 48.50% $9896 306 100 00% Total- Current Assets 6.766.332 6060% 20.394.744 100.00% Fixed Assets 4,400,000 39.40% 0.00% Total Assets (3) 1 $11 166 332 100 00% $20 394 744 100 00% Cost Cost 0.00%) Accounts Payable $1,000,000 11.13%) 0.00% 0.00% 0009 $800,000 7.16% 0.00% 0.00% 000%| 0.00% Note Payable Bank Total Liabilities 3200 000 4,200,000 35.61%) 3.72%, 1.32%) 2.800 000 28 29%) 3.72% 1.05% 2 3,200,000 2866% 000 21 49% 3.72%) 0.80% 0.00%, 372%| 0.00% 46.73% 53.27%23.84%, 1270% 100.0096 3,600,000 6,296,306 $9,890.300 36.38% 63.62% 100.00% 0.00% 100.00% 100.00% Equity 4,786 867 23.0296 1465% 7966332 7134%, 22.149 15 8096 20,394,744 154490 15.44% Total Liabes & Equity | 8.98655 $11,166,332 100.00% $20394144 WACC on total invested capital ear ear ear ear Operating Activities $741,867$1,334,438 $1,491,027 $13,628,412 Net Income Depreciation Other non-cash expenses Increase in accounts receivable Increase in inventories Increase/decrease in accounts payable 400,000 145,000 -350,000 50,000 -100,000 400,000 175,000 -300,000 50,000 -200,000 786,867 1,359,438 400,000 179,000 -700,000 -70,000 2,500,000 520,000 Subtotal - Net cash provided by operating activities Long-term Investing Activities Subtotal - Net cash used in investing activities 1,300,027 16,648,412 Purchase or sale of fixed assets 0 0 Financing Activities 400,000 0 0 0 -400,000 400,000 Decrease in notes payable Increase/decrease in bonds outstanding Payment of dividends to stockholders Sale or repurchase of stock 400,000 0 0 -400,000 Subtotal - Net cash provided by financing activities 400,000 Summary Net increase in cash 900,027 16,648,412 3,746,332 $1,886,867 $2,846,306 $3,746,332 $20,394,744 386.867 1,500,000 959,438 1,886,867 Cash and equivalents at the beginning of the year 2,846,306 Total - Cash and equivalents at the end of the year ear Cash Short Term Securities Accounts Recervable Inventory $1,886 867 21.00% $2,846 306 28 76% $3,746,332 3355% $0 20,394,744 00096 100.00% 0.00% 0.00% 1,500,000 16.69% 1.800.000 18,19% 2,500,000 22.39% 520,000 466% 400.000 4.45% 3,786,867.2 42.14% 5200000 57.86% $8986 867 100 00% 450.000 4.55% 5096.3056 51.50% 4,800,000" 48.50% $9896 306 100 00% Total- Current Assets 6.766.332 6060% 20.394.744 100.00% Fixed Assets 4,400,000 39.40% 0.00% Total Assets (3) 1 $11 166 332 100 00% $20 394 744 100 00% Cost Cost 0.00%) Accounts Payable $1,000,000 11.13%) 0.00% 0.00% 0009 $800,000 7.16% 0.00% 0.00% 000%| 0.00% Note Payable Bank Total Liabilities 3200 000 4,200,000 35.61%) 3.72%, 1.32%) 2.800 000 28 29%) 3.72% 1.05% 2 3,200,000 2866% 000 21 49% 3.72%) 0.80% 0.00%, 372%| 0.00% 46.73% 53.27%23.84%, 1270% 100.0096 3,600,000 6,296,306 $9,890.300 36.38% 63.62% 100.00% 0.00% 100.00% 100.00% Equity 4,786 867 23.0296 1465% 7966332 7134%, 22.149 15 8096 20,394,744 154490 15.44% Total Liabes & Equity | 8.98655 $11,166,332 100.00% $20394144 WACC on total invested capital ear ear ear ear Operating Activities $741,867$1,334,438 $1,491,027 $13,628,412 Net Income Depreciation Other non-cash expenses Increase in accounts receivable Increase in inventories Increase/decrease in accounts payable 400,000 145,000 -350,000 50,000 -100,000 400,000 175,000 -300,000 50,000 -200,000 786,867 1,359,438 400,000 179,000 -700,000 -70,000 2,500,000 520,000 Subtotal - Net cash provided by operating activities Long-term Investing Activities Subtotal - Net cash used in investing activities 1,300,027 16,648,412 Purchase or sale of fixed assets 0 0 Financing Activities 400,000 0 0 0 -400,000 400,000 Decrease in notes payable Increase/decrease in bonds outstanding Payment of dividends to stockholders Sale or repurchase of stock 400,000 0 0 -400,000 Subtotal - Net cash provided by financing activities 400,000 Summary Net increase in cash 900,027 16,648,412 3,746,332 $1,886,867 $2,846,306 $3,746,332 $20,394,744 386.867 1,500,000 959,438 1,886,867 Cash and equivalents at the beginning of the year 2,846,306 Total - Cash and equivalents at the end of the year