

Question
1. What would be the demand forecast, total demand forecast and net profit for each cycling model using the Judgmental. Forecasting method? Note: You can
1. What would be the demand forecast, total demand forecast and net profit for each cycling model using the Judgmental. Forecasting method? Note: You can find the demand forecasts of the experts for 2014 in Table 2 in the article (FC1 in the table shows the demand forecast of Mr Arnold, the CEO of the company). 2013 demand forecasts and realisations are given in Table 1. 2. If the average of the demand forecasts of the whole group was used as the forecast for the next year ( Means (Average) Forecasting), what would be the demand forecast and total demand forecast and net profit for each cycling model? 3. The average growth rate of the company for the last 4 years is 23% What would be the demand forecast, total demand forecast and net profit for each cycling model when demand forecasting is done with Means ( Average) Forecasting + Growth Rate approach? 4. What would be the demand forecasts and net profit if the growth rate of 2013, which is 17%, was used as the growth rate in Question-3? 5. The proportions of the models in the total demand in 2013 are given in the table below. What would be the total demand, the demand forecast for each bicycle model and the net profit if the total demand forecast was made for each bicycle model considering the ratios of the previous year, using a Top-Down approach for demand forecasting? You can use your forecast in Question-3 as the total dernand forecast for 2014. Grand Canyon % 5.4 Nerve % 15.2 Yellowstone 23.4 Strive% 16.6 Speedmax % 5.1 Roadlite % 10.3 Ultimate % 5.1 Endurance % 19.16. What would be the demand forecast, total demand forecast and net profit for each cycling madel if demand forecasting was performed with the Adjusted Mean Forecasting (0) demand approach using the A/F ratio of the group's average demand at Level-0 (
Note: A/F ratio at Level-0 1.162)? 7.
What would be the demand forecast, total
demand forecast and net profit for each cycling model if demand forecasting was performed with the Adjusted Mean Forecasting (L1) demand approach using the A/F ratios of the average demand of the group at Level-1 (Note: A/F ratio at Level-1, MTB 1.162 and RB 1.079)? 8. What would be the demand forecast, total demand forecast and net profit for each cycling model if the group's average demand was forecasted with the Adjusted Mean Forecasting (L2) demand approach using the A/F ratios at Level-2 (Note: A/F ratios at Level-2, MTB AL 1.324, MTB CF 1.277, and RB_CF 1.165, RB AL 0.880)? Note: When we forecast demand with the above methods, our order quantity for production will be equal to our demand forecast. Since we do not use the "Newsboy Model' as in the method we discussed in class (since we do not
consider randomness in the forecast), the
order quantity is equal to the demand
forecast.
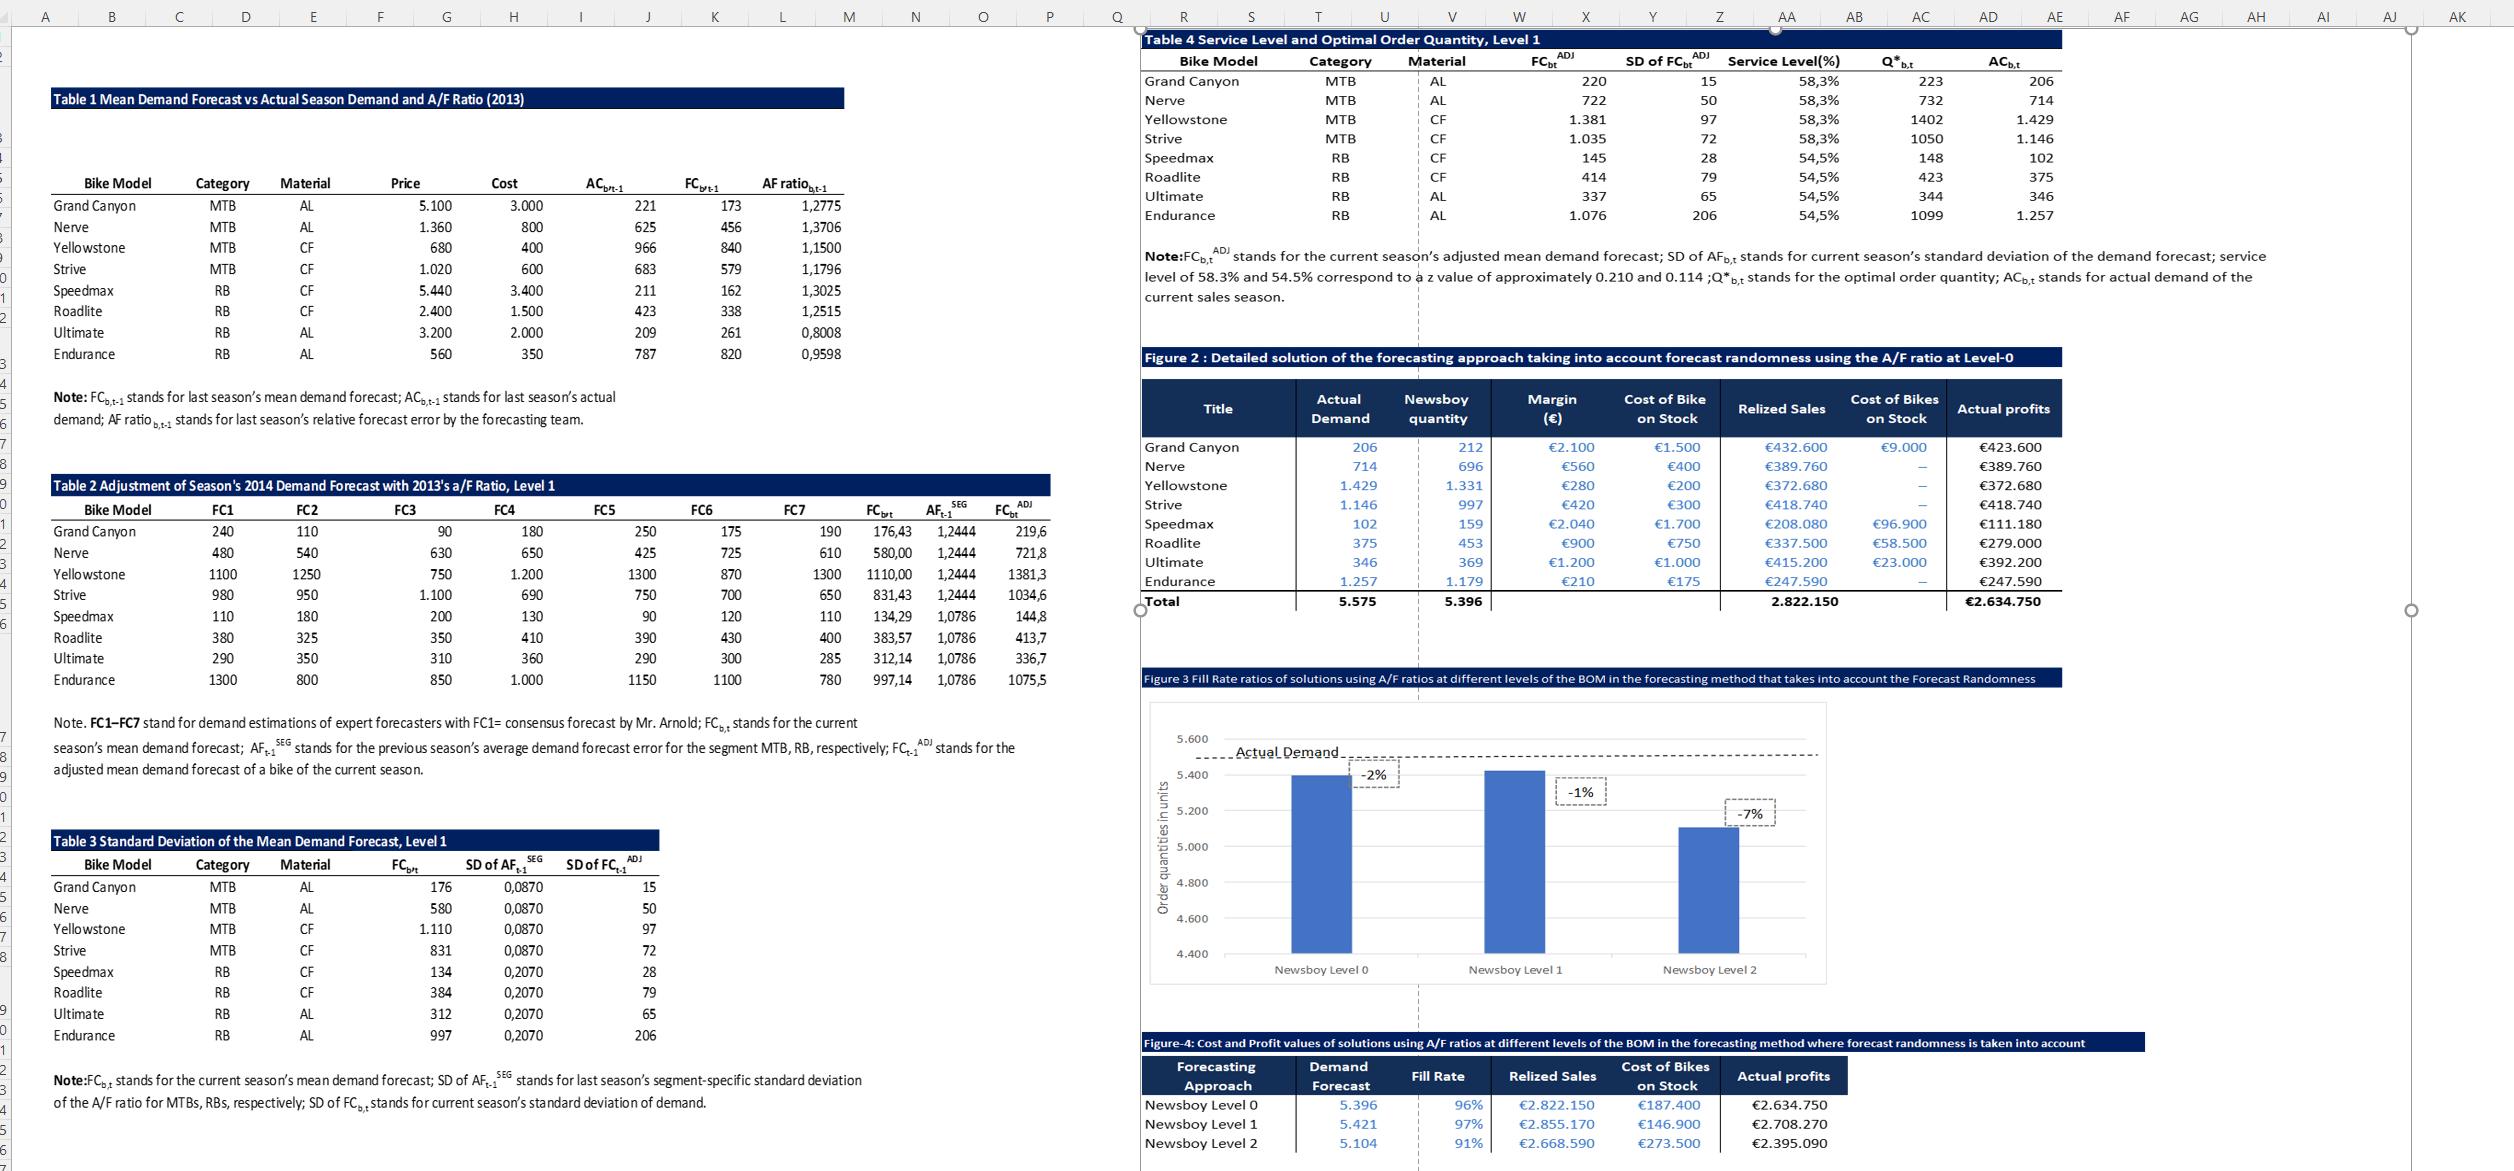
0 1 2 3 4 5 6 4 5 6 8 9 8 9 0 4 A B Bike Model Grand Canyon Nerve Yellowstone Strive Speedmax Roadlite Ultimate Endurance Grand Canyon Nerve Yellowstone Table 1 Mean Demand Forecast vs Actual Season Demand and A/F Ratio (2013) Strive Speedmax Roadlite Ultimate Endurance Category MTB MTB MTB MTB RB RB RB RB Grand Canyon Nerve Yellowstone Strive Speedmax Roadlite Ultimate Endurance D FC1 240 480 1100 980 110 380 290 1300 E Material AL AL CF CF CF CF AL AL F Note: FCb,t-1 stands for last season's mean demand forecast; AC-1 stands for last season's actual demand; AF ratio ,-1 stands for last season's relative forecast error by the forecasting team. Table 2 Adjustment of Season's 2014 Demand Forecast with 2013's a/F Ratio, Level 1 Bike Model FC2 FC3 FC4 110 540 1250 950 180 325 350 800 Category MTB MTB MTB MTB RB RB RB RB G Price 5.100 1.360 680 1.020 5.440 2.400 3.200 560 Table 3 Standard Deviation of the Mean Demand Forecast, Level 1 Bike Model FCbt Material AL AL CF CF CF CF AL AL H 90 630 750 1.100 200 350 310 850 Cost 3.000 800 400 600 3.400 1.500 2.000 350 176 580 1.110 831 134 384 312 997 180 650 1.200 690 130 410 360 1.000 SEG ACpt-1 SD of AF1 0,0870 0,0870 0,0870 0,0870 0,2070 0,2070 0,2070 0,2070 FC5 221 625 966 683 211 423 209 787 250 425 1300 750 90 390 290 1150 SD of FC.1 ADJ FC+1 15 50 97 72 28 79 65 206 FC6 173 456 840 579 162 338 261 820 175 725 870 700 120 430 300 1100 Note. FC1-FC7 stand for demand estimations of expert forecasters with FC1= consensus forecast by Mr. Arnold; FC, stands for the current season's mean demand forecast; AFSEG stands for the previous season's average demand forecast error for the segment MTB, RB, respectively; FCAD stands for the adjusted mean demand forecast of a bike of the current season. L AF ratiot-1 1,2775 1,3706 1,1500 1,1796 1,3025 1,2515 0,8008 0,9598 FC7 M N 190 610 SEG AFt-1 Note:FC, stands for the current season's mean demand forecast; SD of AF SEG stands for last season's segment-specific standard deviation of the A/F ratio for MTBs, RBs, respectively; SD of FC, stands for current season's standard deviation of demand. O FCbrt 176,43 1,2444 580,00 1,2444 1110,00 1,2444 1300 650 831,43 1,2444 110 134,29 1,0786 400 383,57 1,0786 285 312,14 1,0786 997,14 1,0786 1075,5 780 FC ADJ P 219,6 721,8 1381,3 1034,6 144,8 413,7 336,7 Q S U W Table 4 Service Level and Optimal Order Quantity, Level 1 FCbt Bike Model Grand Canyon Nerve Yellowstone Strive Speedmax Roadlite Ultimate Endurance Title Grand Canyon Nerve Yellowstone Strive Speedmax Roadlite Ultimate Endurance Total Order quantities in units 5.600 5.400 ADJ 5.200 5.000 4.800 4.600 Category MTB MTB MTB MTB RB RB RB RB 4.400 Actual Demand 206 714 1.429 1.146 Forecasting Approach Newsboy Level 0 Newsboy Level 1 Newsboy Level 2 102 375 346 1.257 5.575 Actual Demand. Material AL AL -2% CF CF CF CF AL AL Newsboy Level 0 Figure 2: Detailed solution of the forecasting approach taking into account forecast randomness using the A/F ratio at Level-0 Demand Forecast 5.396 5.421 5.104 Newsboy quantity Note:FCb,t stands for the current season's adjusted mean demand forecast; SD of AFb,t stands for current season's standard deviation of the demand forecast; service level of 58.3% and 54.5% correspond to a z value of approximately 0.210 and 0.114 ;Q* b,t stands for the optimal order quantity; ACb,t stands for actual demand of the current sales season. 212 696 1.331 997 159 453 369 1.179 5.396 ADJ Fill Rate X 220 722 1.381 1.035 96% 97% 91% 145 414 337 1.076 Margin () Newsboy Level 1 2.100 560 280 420 2.040 900 1.200 210 ADJ -1% SD of FCbt Relized Sales 15 50 97 72 28 79 65 206 2.822.150 2.855.170 2.668.590 Z Cost of Bike on Stock Figure 3 Fill Rate ratios of solutions using A/F ratios at different levels of the BOM in the forecasting method that takes into account the Forecast Randomness 1.500 400 200 300 1.700 750 1.000 175 Service Level(%) 58,3% 58,3% 58,3% 58,3% 54,5% 54,5% 54,5% 54,5% AA Relized Sales -7% Newsboy Level 2 432.600 389.760 372.680 418.740 208.080 337.500 415.200 247.590 2.822.150 AB AC Q*b,t Actual profits 223 732 1402 1050 148 423 344 1099 2.634.750 2.708.270 2.395.090 Cost of Bikes on Stock AD 9.000 ACb.t 96.900 58.500 23.000 Figure-4: Cost and Profit values of solutions using A/F ratios at different levels of the BOM in the forecasting method where forecast randomness is taken into account Cost of Bikes on Stock 187.400 146.900 273.500 206 714 1.429 1.146 102 375 346 1.257 AE Actual profits 423.600 389.760 372.680 418.740 111.180 279.000 392.200 247.590 2.634.750 AF AG AH Al AJ O AK
Step by Step Solution
There are 3 Steps involved in it
Step: 1

Get Instant Access with AI-Powered Solutions
See step-by-step solutions with expert insights and AI powered tools for academic success
Step: 2

Step: 3
Ace Your Homework with AI
Get the answers you need in no time with our AI-driven, step-by-step assistance
Get Started
Understanding Cross Cultural Management
Authors: Marie Joelle Browaeys, Roger Price
3rd Edition
1292015896, 978-1292015897