Answered step by step
Verified Expert Solution
Question
1 Approved Answer
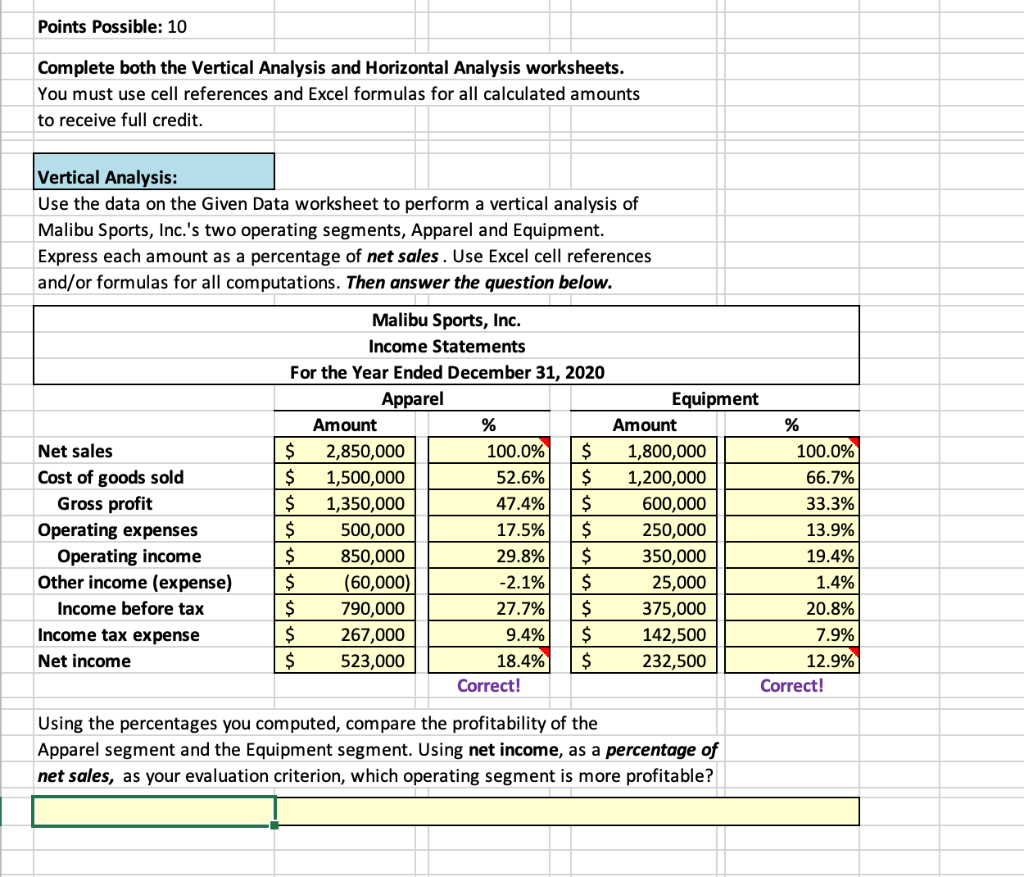
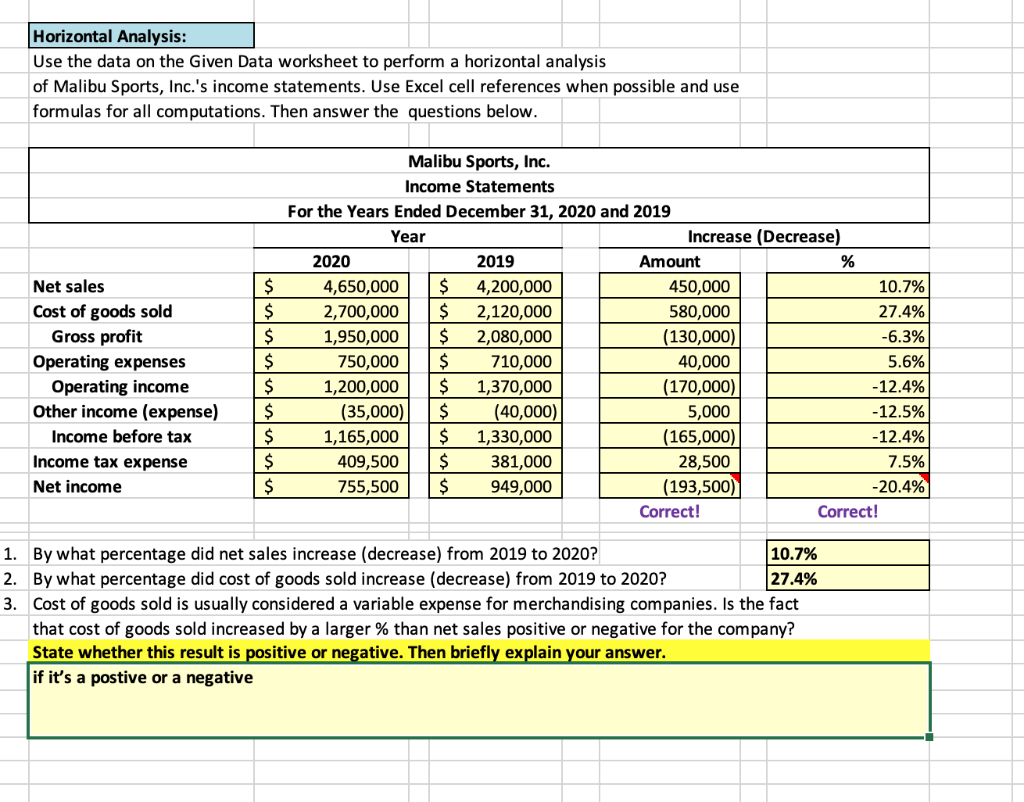
1.) Which is more profitable? Apparel or Equipment 2.) State whether this result is positive or negative. then briefly explain your answer. Points Possible: 10


1.) Which is more profitable? Apparel or Equipment
2.) State whether this result is positive or negative. then briefly explain your answer.
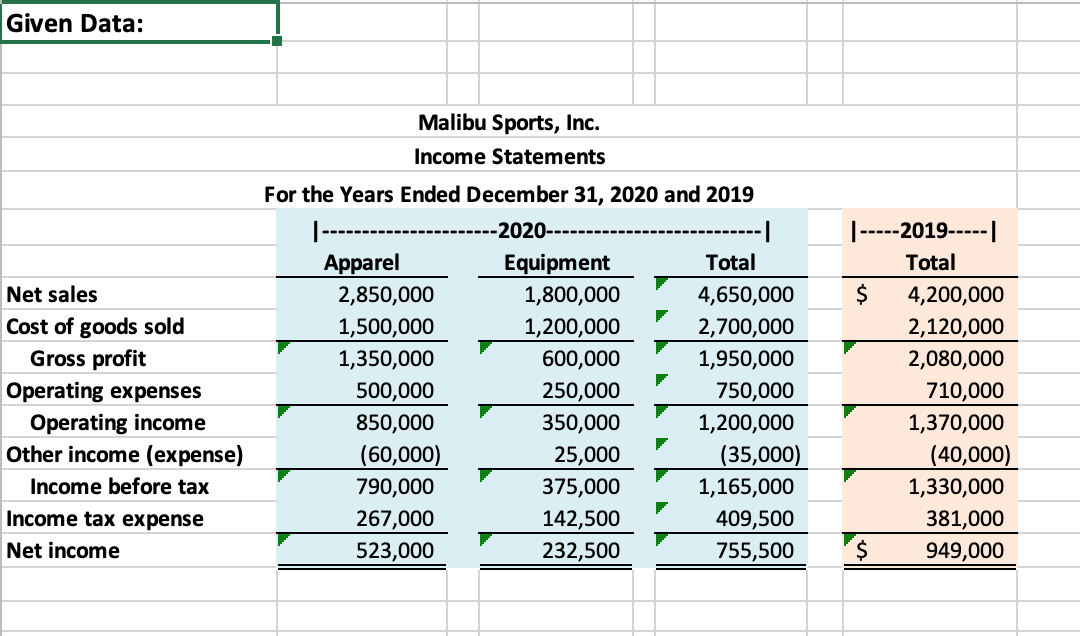
Points Possible: 10 Complete both the Vertical Analysis and Horizontal Analysis worksheets. You must use cell references and Excel formulas for all calculated amounts to receive full credit. Vertical Analysis: Use the data on the Given Data worksheet to perform a vertical analysis of Malibu Sports, Inc.'s two operating segments, Apparel and Equipment. Express each amount as a percentage of net sales. Use Excel cell references and/or formulas for all computations. Then answer the question below. Net sales Cost of goods sold Gross profit Operating expenses Operating income Other income (expense) Income before tax Income tax expense Net income Malibu Sports, Inc. Income Statements For the Year Ended December 31, 2020 Apparel Equipment Amount % Amount % $ 2,850,000 100.0% $ 1,800,000 100.0% $ 1,500,000 52.6% $ 1,200,000 66.7% $ 1,350,000 47.4% $ 600,000 33.3% $ 500,000 17.5% $ 250,000 13.9% $ 850,000 29.8% $ 350,000 19.4% $ (60,000) -2.1% $ 25,000 1.4% $ 790,000 27.7% $ 375,000 20.8% $ 267,000 9.4% $ 142,500 7.9% $ 523,000 18.4% $ 232,500 12.9% Correct! Correct! Using the percentages you computed, compare the profitability of the Apparel segment and the Equipment segment. Using net income, as a percentage of net sales, as your evaluation criterion, which operating segment is more profitable? Horizontal Analysis: Use the data on the Given Data worksheet to perform a horizontal analysis of Malibu Sports, Inc.'s income statements. Use Excel cell references when possible and use formulas for all computations. Then answer the questions below. Net sales Cost of goods sold Gross profit Operating expenses Operating income Other income (expense) Income before tax Income tax expense Net income $ $ $ $ $ $ $ $ $ Malibu Sports, Inc. Income Statements For the Years Ended December 31, 2020 and 2019 Year Increase (Decrease) 2020 2019 Amount % 4,650,000 $ 4,200,000 450,000 10.7% 2,700,000 $ 2,120,000 580,000 27.4% 1,950,000 $ 2,080,000 (130,000) -6.3% 750,000 $ 710,000 40,000 5.6% 1,200,000 $ 1,370,000 (170,000) -12.4% (35,000) $ (40,000) 5,000 1,165,000 $ 1,330,000 (165,000) -12.4% 409,500 $ 381,000 28,500 7.5% 755,500 $ 949,000 (193,500) -20.4% Correct! Correct! -12.5% 1. By what percentage did net sales increase (decrease) from 2019 to 2020? 10.7% 2. By what percentage did cost of goods sold increase (decrease) from 2019 to 2020? 27.4% 3. Cost of goods sold is usually considered a variable expense for merchandising companies. Is the fact that cost of goods sold increased by a larger % than net sales positive or negative for the company? State whether this result is positive or negative. Then briefly explain your answer. if it's a postive or a negative Given Data: Malibu Sports, Inc. Income Statements Net sales Cost of goods sold Gross profit Operating expenses Operating income Other income (expense) Income before tax Income tax expense Net income For the Years Ended December 31, 2020 and 2019 -2020--- Apparel Equipment Total 2,850,000 1,800,000 4,650,000 1,500,000 1,200,000 2,700,000 1,350,000 600,000 1,950,000 500,000 250,000 750,000 850,000 350,000 1,200,000 (60,000) 25,000 (35,000) 790,000 375,000 1,165,000 267,000 142,500 409,500 523,000 232,500 755,500 -----2019-----| Total $ 4,200,000 2,120,000 2,080,000 710,000 1,370,000 (40,000) 1,330,000 381,000 $ 949,000Step by Step Solution
There are 3 Steps involved in it
Step: 1

Get Instant Access to Expert-Tailored Solutions
See step-by-step solutions with expert insights and AI powered tools for academic success
Step: 2

Step: 3

Ace Your Homework with AI
Get the answers you need in no time with our AI-driven, step-by-step assistance
Get Started


