

Question
1) Which one of the following cannot be interpreted from the C-Tek Corporation case exhibit below? a. Chicago looks the most attractive sources for sales
1) Which one of the following cannot be interpreted from the C-Tek Corporation case exhibit below?
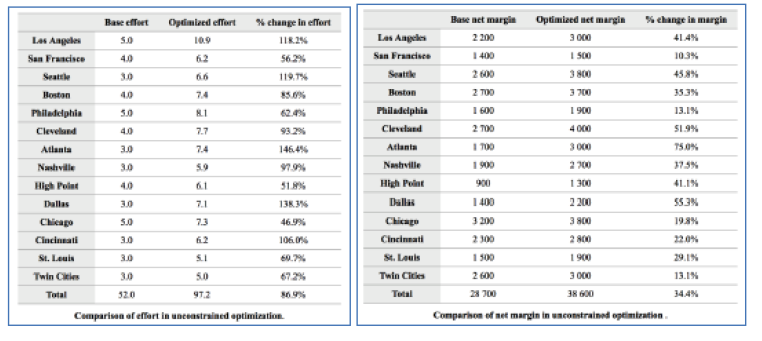
a. Chicago looks the most attractive sources for sales rep reduction
b. Profit gains require 87% increase in sales reps
c. A net margin potential is roughly 10 million
d. Atlanta seem to the branche with the most upside potential
2) Respondents preference partworths are computed based on a flight and shown below. If the partworths are based on a 100-point scale, which one of the following is true?
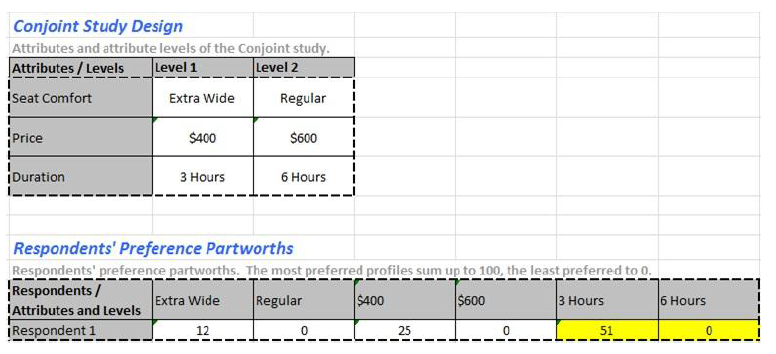
a. Respondent can compensate extra-wide seat for regular seat for about $200
b. Respondent can compensate extra-wide seat for regular seat for about $100
c. Respondent can compensate extra-wide seat for regular seat for about $50
d. Respondent is indifferent about Seat Comfort and Duration of a flight
3) A regression analysis between sales (in $1000) and price (in dollars) resulted in the following equation
Y = 50,000 - 8X
The above equation implies that an
a. increase of $1 in price is associated with a decrease of $8 in sales
b. increase of $8 in price is associated with an increase of $8,000 in sales
c. increase of $1 in price is associated with a decrease of $42,000 in sales
d. increase of $1 in price is associated with a decrease of $8000 in sales
Base cft Optimized net margin Optimeed effort 10.9 change in effort 118.2% 3 000 Los Angeles San Francisco % change in margin 41.4% 10.3% 40 1 500 62 6.6 Base act margin 2 200 1400 2600 2 700 1 600 45.8% 40 74 3800 3700 1 900 353% 5.0 11 Los Angeles San Francisco Seattle Hoston Philadelphia Cleveland Atlanta Nashville High Point Dallas Boston Philadelphia Cleveland Atlanta 7.7 2700 4.0 3.0 4000 3 OCO 13.1% 51.9% 75.0% 7.4 1700 146.4% 97.995 3.0 SO 2700 Nashville High Point Dulles 1900 900 17.5% 4119 51. 1400 55.3% 7.1 73 136.3% 46.9% 106.0% 2 200 3 800 5.0 3 200 19.8% 2300 22.0% Cincinnati St. Louis Twin Cities SI Cincinnati St. Louis Twin Cities 1 500 2600 1900 3 000 3.0 50 672% 13.1% Total 320 91.2 Total 2700 344% 38 600 Comparhom of net margin in constrained optimization Cumparison of effort in uneasted optimization Conjoint Study Design Attributes and attribute levels of the Conjoint study. Attributes / Levels Level 1 Level 2 Seat Comfort Extra Wide Regular Price $400 $600 Duration 3 Hours 6 Hours Respondents' Preference Partworths Respondents' preference partworths. The most preferred profiles sum up to 100, the least preferred to 0. Respondents / Extra Wide Regular $400 $600 3 Hours Attributes and levels Respondent 1 12 25 6 Hours 51 Base cft Optimized net margin Optimeed effort 10.9 change in effort 118.2% 3 000 Los Angeles San Francisco % change in margin 41.4% 10.3% 40 1 500 62 6.6 Base act margin 2 200 1400 2600 2 700 1 600 45.8% 40 74 3800 3700 1 900 353% 5.0 11 Los Angeles San Francisco Seattle Hoston Philadelphia Cleveland Atlanta Nashville High Point Dallas Boston Philadelphia Cleveland Atlanta 7.7 2700 4.0 3.0 4000 3 OCO 13.1% 51.9% 75.0% 7.4 1700 146.4% 97.995 3.0 SO 2700 Nashville High Point Dulles 1900 900 17.5% 4119 51. 1400 55.3% 7.1 73 136.3% 46.9% 106.0% 2 200 3 800 5.0 3 200 19.8% 2300 22.0% Cincinnati St. Louis Twin Cities SI Cincinnati St. Louis Twin Cities 1 500 2600 1900 3 000 3.0 50 672% 13.1% Total 320 91.2 Total 2700 344% 38 600 Comparhom of net margin in constrained optimization Cumparison of effort in uneasted optimization Conjoint Study Design Attributes and attribute levels of the Conjoint study. Attributes / Levels Level 1 Level 2 Seat Comfort Extra Wide Regular Price $400 $600 Duration 3 Hours 6 Hours Respondents' Preference Partworths Respondents' preference partworths. The most preferred profiles sum up to 100, the least preferred to 0. Respondents / Extra Wide Regular $400 $600 3 Hours Attributes and levels Respondent 1 12 25 6 Hours 51Step by Step Solution
There are 3 Steps involved in it
Step: 1

Get Instant Access to Expert-Tailored Solutions
See step-by-step solutions with expert insights and AI powered tools for academic success
Step: 2

Step: 3
Ace Your Homework with AI
Get the answers you need in no time with our AI-driven, step-by-step assistance
Get Started
The Accounts Receivable Blueprint Unlocking Financial Success With Proven Strategies
Authors: Simon Udeh Andrew
979-8399614939