Answered step by step
Verified Expert Solution
Question
1 Approved Answer
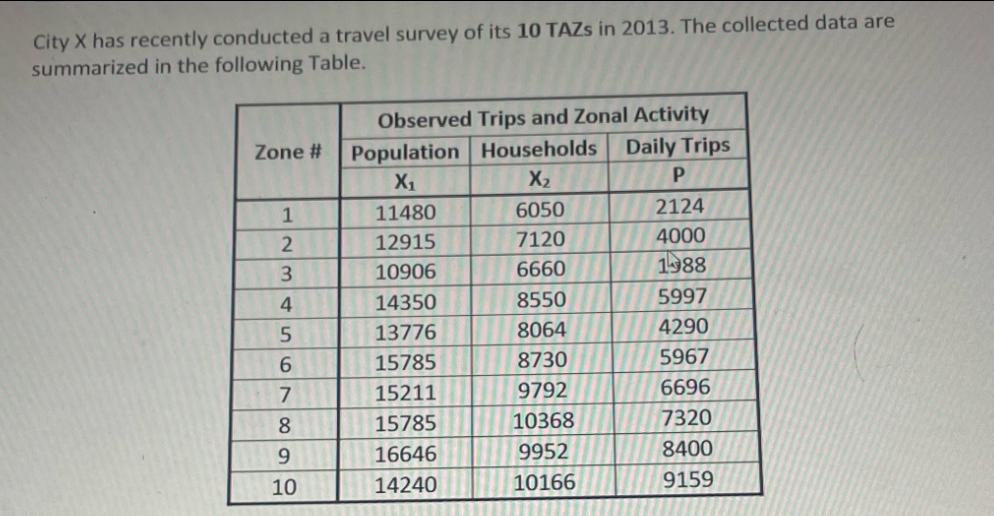
City X has recently conducted a travel survey of its 10 TAZS in 2013. The collected data are summarized in the following Table. Zone


City X has recently conducted a travel survey of its 10 TAZS in 2013. The collected data are summarized in the following Table. Zone # 123456789 10 Observed Trips and Zonal Activity Households Daily Trips X P 6050 2124 7120 4000 6660 1988 8550 5997 8064 4290 8730 5967 9792 6696 10368 7320 9952 8400 10166 9159 Population X 11480 12915 10906 14350 13776 15785 15211 15785 16646 14240 Based on the given information: a) Relate P (total trips produced by a zone) to X (zonal population). Plot P vs. X and the line representing P = bo + bX. b) Relate P (total trips produced by a zone) to X (zonal households). Plot P vs. X and the line representing P = bo' + b'X2. c) Comparing R2 values between two models obtained from Questions (a) and (b), which one is more preferable? Why? d) Given Tables 1 and 2 for a simple four-zone study area (zones 6, 7, 8, and 9) in City X in 2023:
Step by Step Solution
★★★★★
3.30 Rating (162 Votes )
There are 3 Steps involved in it
Step: 1
a Plotting P vs X1 P 2146X1 24553 R2 09296 b Plotting P vs X2 P 5669X2 32832 R2 09457 c ...
Get Instant Access to Expert-Tailored Solutions
See step-by-step solutions with expert insights and AI powered tools for academic success
Step: 2

Step: 3

Ace Your Homework with AI
Get the answers you need in no time with our AI-driven, step-by-step assistance
Get Started


