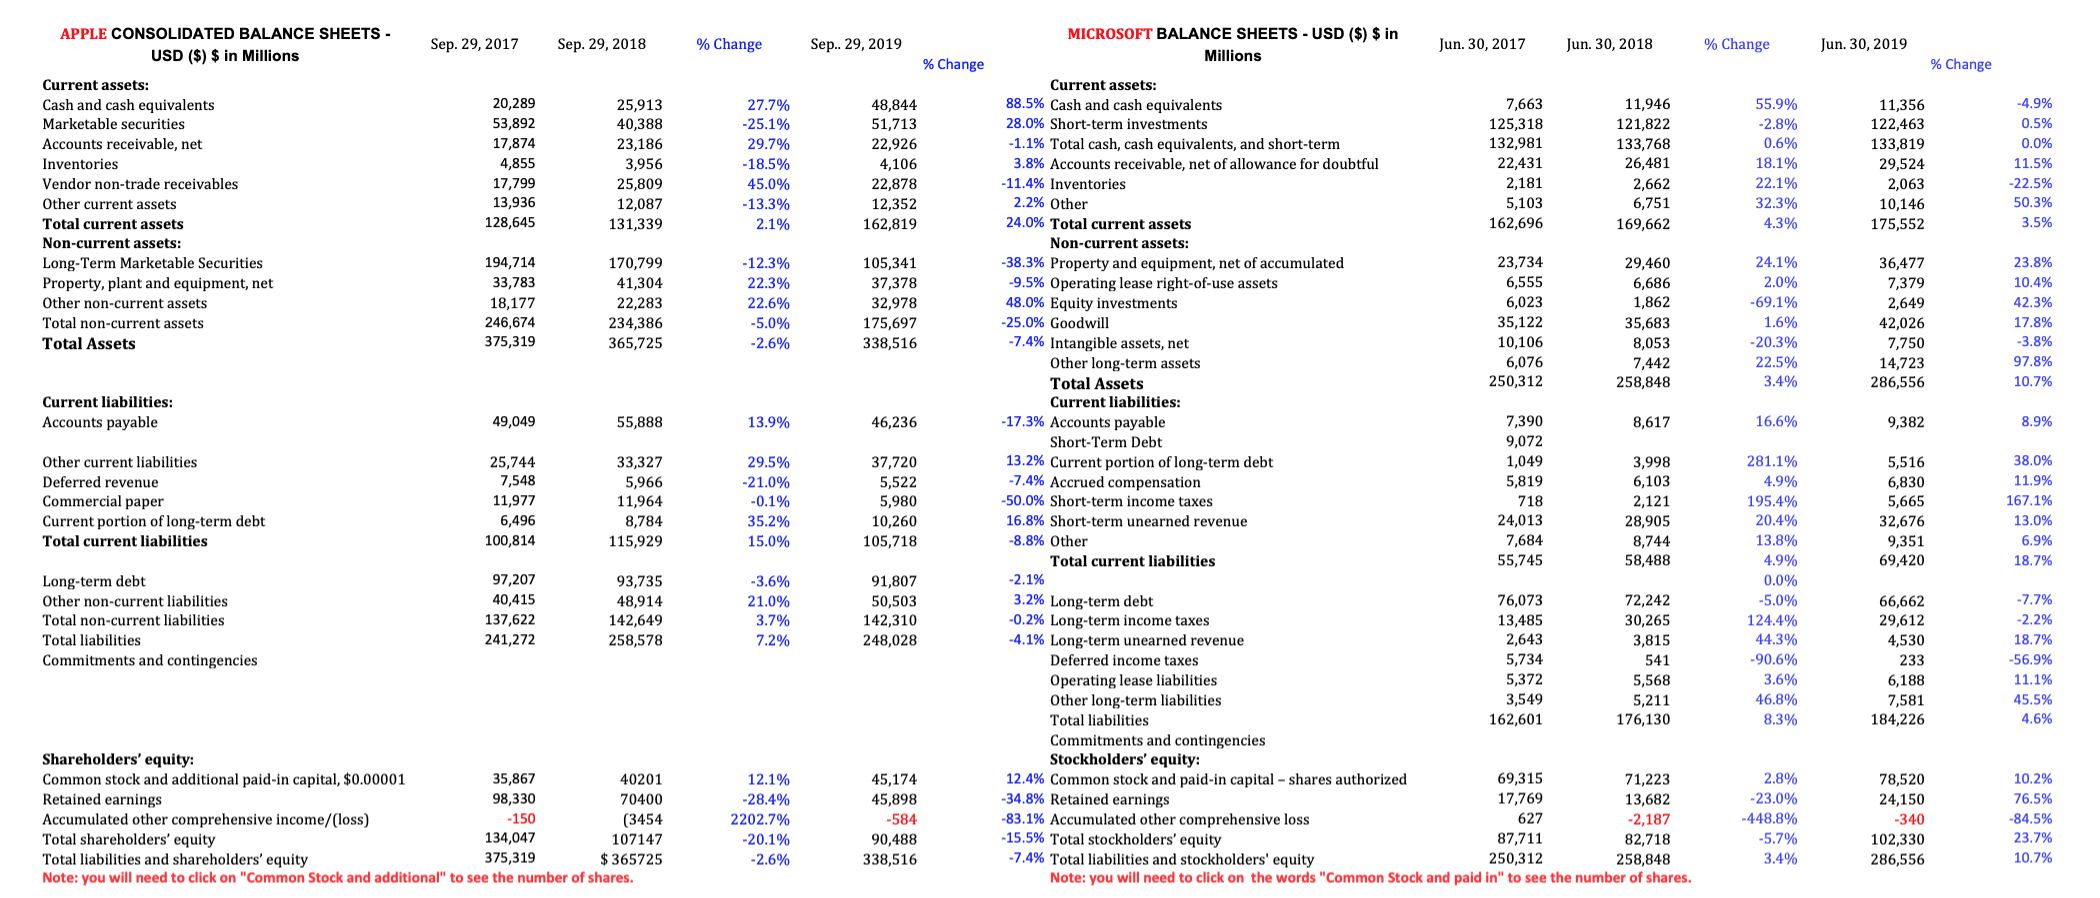
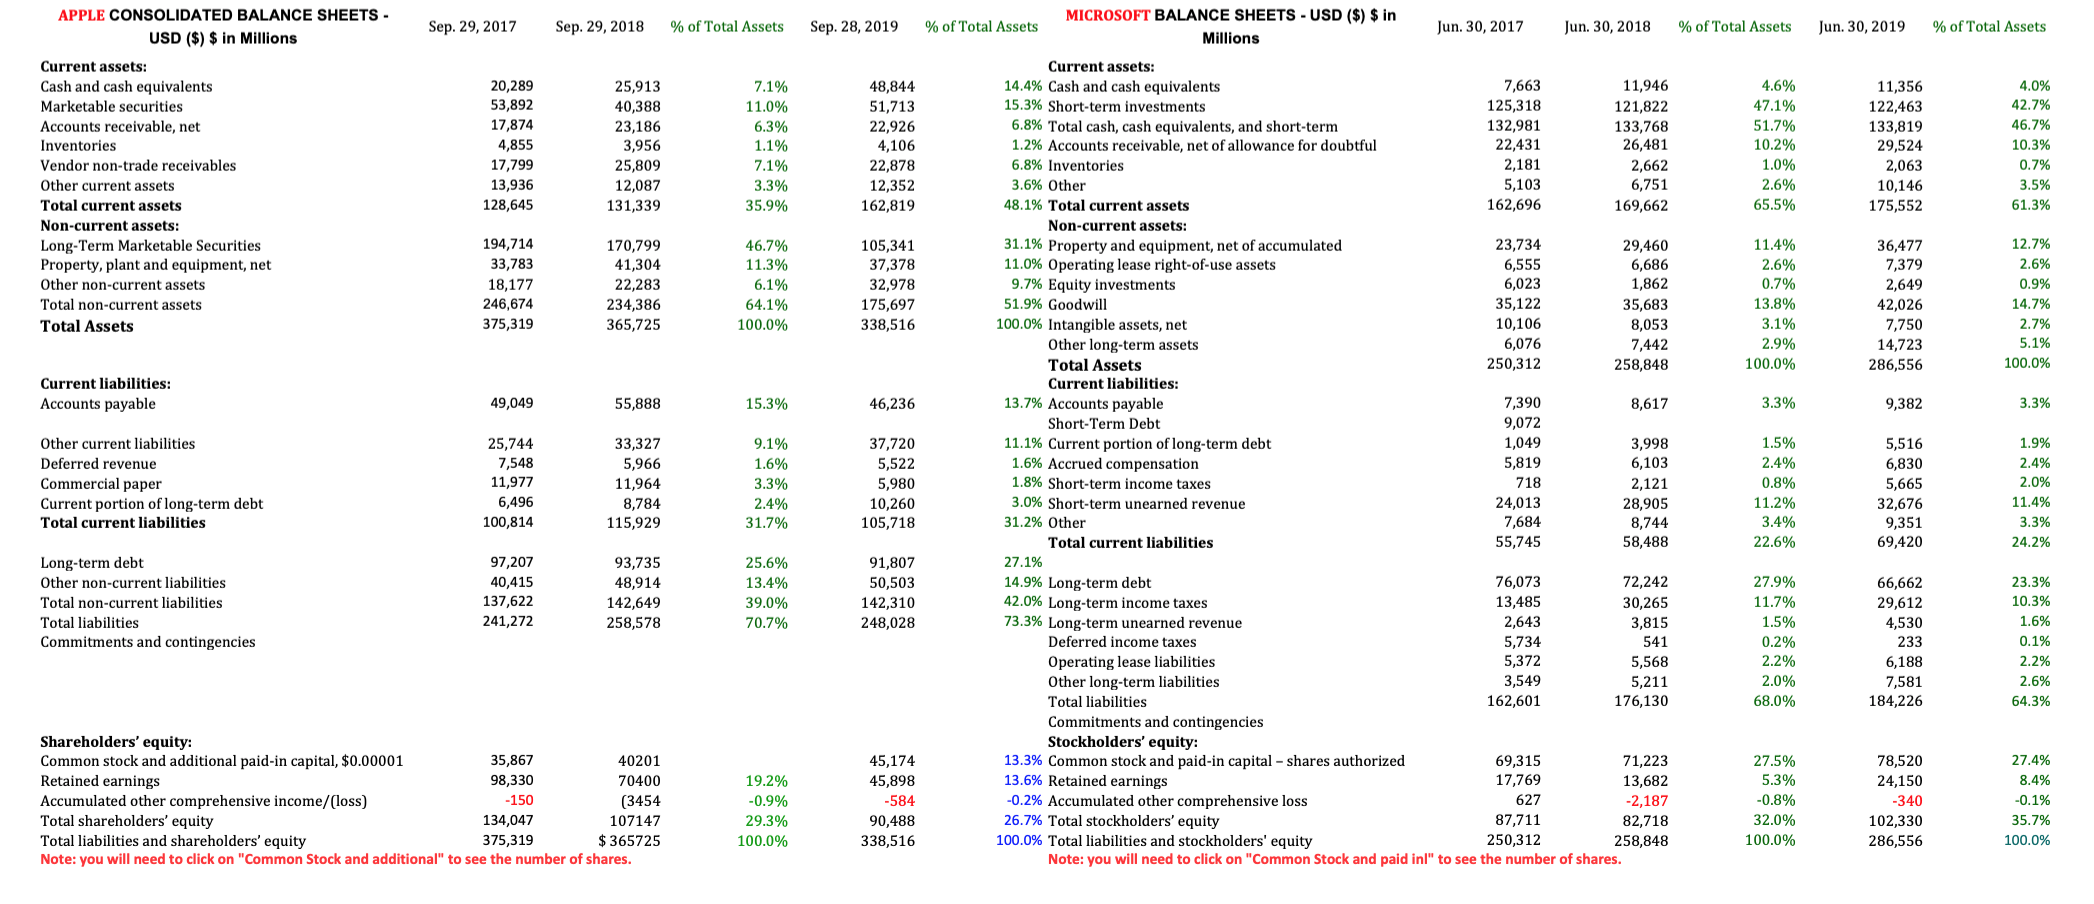
1. Why do you think Apple has a much lower Gross Margin than Microsoft? Why does the gap narrow so much when we look at operating margin? (Hint: look at the financial statements and see what accounts are different).
2. Why did Microsofts Net Profit Margin decline so sharply in 2018? (Hint: look carefully at the financial statements to see what has changed.)
APPLE CONSOLIDATED BALANCE SHEETS - USD ($) $ in Millions Sep. 29, 2017 Sep. 29, 2018 % Change Sep. 29, 2019 MICROSOFT BALANCE SHEETS - USD ($) $ in Millions Jun 30, 2017 Jun 30, 2018 % Change Jun 30, 2019 % Change % Change Current assets: Cash and cash equivalents Marketable securities Accounts receivable, net Inventories Vendor non-trade receivables Other current assets Total current assets Non-current assets: Long-Term Marketable Securities Property, plant and equipment, net Other non-current assets Total non-current assets Total Assets 20,289 53,892 17,874 4,855 17,799 13,936 128,645 25,913 40,388 23,186 3,956 25,809 12,087 131,339 27.7% -25.1% 29.7% -18.5% 45.0% -13.3% 2.1% 48,844 51,713 22,926 4,106 22,878 12,352 162,819 55.9% -2.8% 0.6% 18.1% 22.1% 32.3% 4.3% 11,356 122,463 133,819 29,524 2,063 10,146 175,552 -4.9% 0.5% 0.0% 11.5% -22.5% 50.3% 3.5% 170,799 41,304 194,714 33,783 18,177 246,674 375,319 22,283 234,386 365,725 -12.3% 22.3% 22.6% -5.0% -2.6% 105,341 37,378 32,978 175,697 338,516 24.1% 2.0% -69.1% 1.6% -20.3% 22.5% 3.4% 36,477 7,379 2,649 42,026 7,750 14,723 286,556 23.8% 10.4% 42.3% 17.8% -3.8% 97.8% 10.7% Current liabilities: Accounts payable 49,049 55,888 13.9% 46,236 16.6% 9,382 8.9% Other urrent liabilities Deferred revenue Commercial paper Current portion of long-term debt Total current liabilities 7,548 11,977 6,496 100,814 33,32 5,966 11,964 8,784 115,929 29. -21.0% -0.1% 35.2% 15.0% 720 5,522 5,980 10,260 105,718 Current assets: 88.5% Cash and cash equivalents 7,663 11,946 28.0% Short-term investments 125,318 121,822 -1.1% Total cash, cash equivalents, and short-term 132,981 133,768 3.8% Accounts receivable, net of allowance for doubtful 22,431 26,481 -11.4% Inventories 2,181 2,662 2.2% Other 5,103 6,751 24.0% Total current assets 162,696 169,662 Non-current assets: -38.3% Property and equipment, net of accumulated 23,734 29,460 -9.5% Operating lease right-of-use assets 6,555 6,686 48.0% Equity investments 6,023 1,862 -25.0% Goodwill 35,122 35,683 -7.4% Intangible assets, net 10,106 8,053 Other long-term assets 6,076 7,442 Total Assets 250,312 258,848 Current liabilities: -17.3% Accounts payable 7,390 8,617 Short-Term Debt 9,072 13.2% Current portion of long-term debt 1,049 3,998 -7.4% Accrued compensation 5,819 6,103 -50.0% Short-term income taxes 718 2,121 16.8% Short-term unearned revenue 24,013 28,905 -8.8% Other 7,684 8,744 Total current liabilities 55,745 58,488 -2.1% 3.2% Long-term debt 76,073 72,242 -0.2% Long-term income taxes 13,485 30,265 -4.1% Long-term unearned revenue 2,643 3,815 Deferred income taxes 5,734 541 Operating lease liabilities 5,372 5,568 Other long-term liabilities 3,549 5,211 Total liabilities 162,601 176,130 Commitments and contingencies Stockholders' equity: 12.4% Common stock and paid-in capital - shares authorized 69,315 71,223 -34.8% Retained earnings 17,769 13,682 -83.1% Accumulated other comprehensive loss 627 -2,187 -15.5% Total stockholders' equity 87,711 82,718 -7.4% Total liabilities and stockholders' equity 250,312 258,848 Note: you will need to click on the words "Common Stock and paid in" to see the number of shares. 5,51 6,830 5,665 32,676 9,351 69,420 38.0% 11.9% 167.1% 13.0% 6.9% 18.7% Long-term debt Other non-current liabilities Total non-current liabilities Total liabilities Commitments and contingencies 97,207 40,415 137,622 241,272 93,735 48,914 142,649 258,578 -3.6% 21.0% 3.7% 7.2% 91,807 50,503 142,310 248,028 281.1% 4.9% 195.4% 20.4% 13.8% 4.9% 0.0% -5.0% 124.4% 44.3% -90.6% 3.6% 46.8% 8.3% 66,662 29,612 4,530 233 6,188 7,581 184,226 -7.7% -2.2% 18.7% -56.9% 11.1% 45.5% 4.6% Shareholders' equity: Common stock and additional paid-in capital, $0.00001 35,867 40201 Retained earnings 98,330 70400 Accumulated other comprehensive income/(loss) - 150 (3454 Total shareholders' equity 134,047 107147 Total liabilities and shareholders' equity 375,319 $365725 Note: you will need to click on "Common Stock and additional" to see the number of shares. 12.1% -28.4% 2202.7% -20.1% -2.6% 45,174 45,898 -584 90,488 338,516 2.8% -23.0% -448.8% -5.7% 3.4% 78,520 24,150 -340 102,330 286,556 10.2% 76.5% -84.5% 23.7% 10.7% APPLE CONSOLIDATED BALANCE SHEETS - USD ($) $ in Millions Sep. 29, 2017 Sep. 29, 2018 % of Total Assets Sep. 28, 2019 % of Total Assets MICROSOFT BALANCE SHEETS - USD ($) $ in Millions Jun 30, 2017 Jun 30, 2018 % of Total Assets Jun 30, 2019 % of Total Assets 4.6% 47.1% 51.7% Current assets: Cash and cash equivalents Marketable securities Accounts receivable, net Inventories Vendor non-trade receivables Other current assets Total current assets Non-current assets: Long-Term Marketable Securities Property, plant and equipment, net Other non-current assets Total non-current assets Total Assets 20,289 53,892 17,874 4,855 17,799 13,936 128,645 25,913 40,388 23,186 3,956 25,809 12,087 131,339 7.1% 11.0% 6.3% 1.1% 7.1% 3.3% 35.9% 48,844 51,713 22,926 4,106 22,878 12,352 162,819 10.2% 1.0% 2.6% 65.5% 11,356 122,463 133,819 29,524 2,063 10,146 175,552 4.0% 42.7% 46.7% 10.3% 0.7% 3.5% 61.3% 194,714 33,783 18,177 246,674 375,319 170,799 41,304 22,283 234,386 365,725 46.7% 11.3% 6.1% 64.1% 100.0% 105,341 37,378 32,978 175,697 338,516 11.4% 2.6% 0.7% 13.8% 3.1% 2.9% 100.0% 36,477 7,379 2,649 42,026 7,750 14,723 286,556 12.7% 2.6% 0.9% 14.7% 2.7% 5.1% 100.0% Current liabilities: Accounts payable 49,049 55,888 15.3% 46,236 3.3% 9,382 3.3% Other current liabilities Deferred revenue Commercial paper Current portion of long-term debt Total current liabilities 25,744 7,548 11,977 6,496 100,814 33,327 5,966 11,964 8,784 115,929 9.1% 1.6% 3.3% 2.4% 31.7% 37,720 5,522 5,980 10,260 105,718 Current assets: 14.4% Cash and cash equivalents 7,663 11,946 15.3% Short-term investments 125,318 121,822 6.8% Total cash, cash equivalents, and short-term 132,981 133,768 1.2% Accounts receivable, net of allowance for doubtful 22,431 26,481 6.8% Inventories 2,181 2,662 3.6% Other 5,103 6,751 48.1% Total current assets 162,696 169,662 Non-current assets: 31.1% Property and equipment, net of accumulated 23,734 29,460 11.0% Operating lease right-of-use assets 6,555 6,686 9.7% Equity investments 6,023 1,862 51.9% Goodwill 35,122 35,683 100.0% Intangible assets, net 10,106 8,053 Other long-term assets 6,076 7,442 Total Assets 250,312 258,848 Current liabilities: 13.7% Accounts payable 7,390 8,617 Short-Term Debt 9,072 11.1% Current portion of long-term debt 1,049 3,998 1.6% Accrued compensation 5,819 6,103 1.8% Short-term income taxes 718 2,121 3.0% Short-term unearned revenue 24,013 28,905 31.2% Other 7,684 8,744 Total current liabilities 55,745 58,488 27.1% 14.9% Long-term debt 76,073 72,242 42.0% Long-term income taxes 30,265 73.3% Long-term unearned revenue 2,643 3,815 Deferred income taxes 5,734 541 Operating lease liabilities 5,372 5,568 Other long-term liabilities 3,549 5,211 Total liabilities 162,601 176,130 Commitments and contingencies Stockholders' equity: 13.3% Common stock and paid-in capital - shares authorized 69,315 71,223 13.6% Retained earnings 17,769 13,682 -0.2% Accumulated other comprehensive loss 627 -2,187 26.7% Total stockholders' equity 87,711 82,718 100.0% Total liabilities and stockholders' equity 250,312 258,848 Note: you will need to click on "Common Stock and paid ini" to see the number of shares. 1.5% 2.4% 0.8% 11.2% 3.4% 22.6% 5,516 6,830 5,665 32,676 9,351 69,420 1.9% 2.49 2.0% 11.4% 3.3% 24.2% Long-term debt Other non-current liabilities Total non-current liabilities Total liabilities Commitments and contingencies 97,207 40,415 137,622 241,272 93,735 48,914 142,649 258,578 25.6% 13.4% 39.0% 70.7% 91,807 50,503 142,310 248,028 13,485 27.9% 11.7% 1.5% 0.2% 2.2% 2.0% 68.0% 66,662 29,612 4,530 233 6,188 7,581 184,226 23.3% 10.3% 1.6% 0.1% 2.2% 2.6% 64.3% Shareholders' equity: Common stock and additional paid-in capital, $0.00001 35,867 40201 Retained earnings 98,330 70400 Accumulated other comprehensive income/(loss) -150 (3454 Total shareholders' equity 134,047 107147 Total liabilities and shareholders' equity 375,319 $365725 Note: you will need to click on "Common Stock and additional" to see the number of shares. 19.2% -0.9% 29.3% 100.0% 45,174 45,898 -584 90,488 338,516 27.5% 5.3% -0.8% 32.0% 100.0% 78,520 24,150 -340 102,330 286,556 27.4% 8.4% -0.1% 35.7% 100.0%