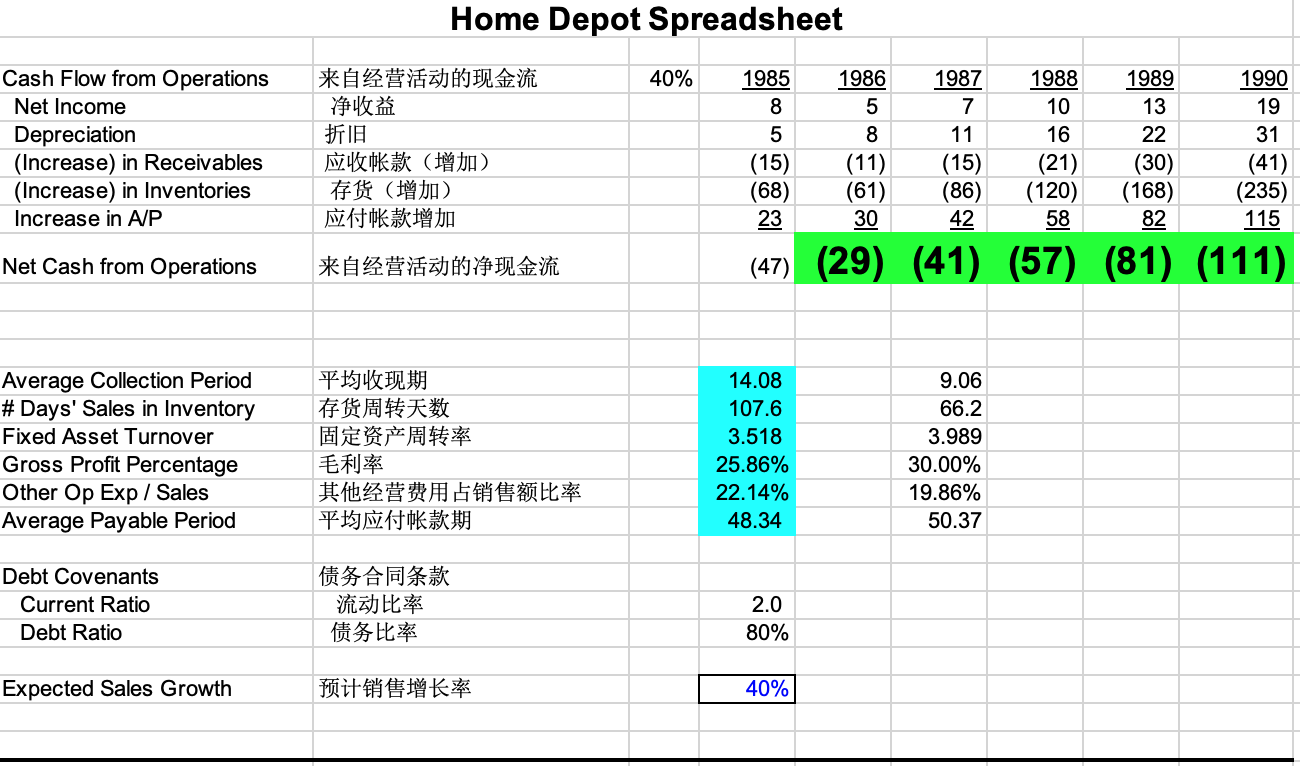
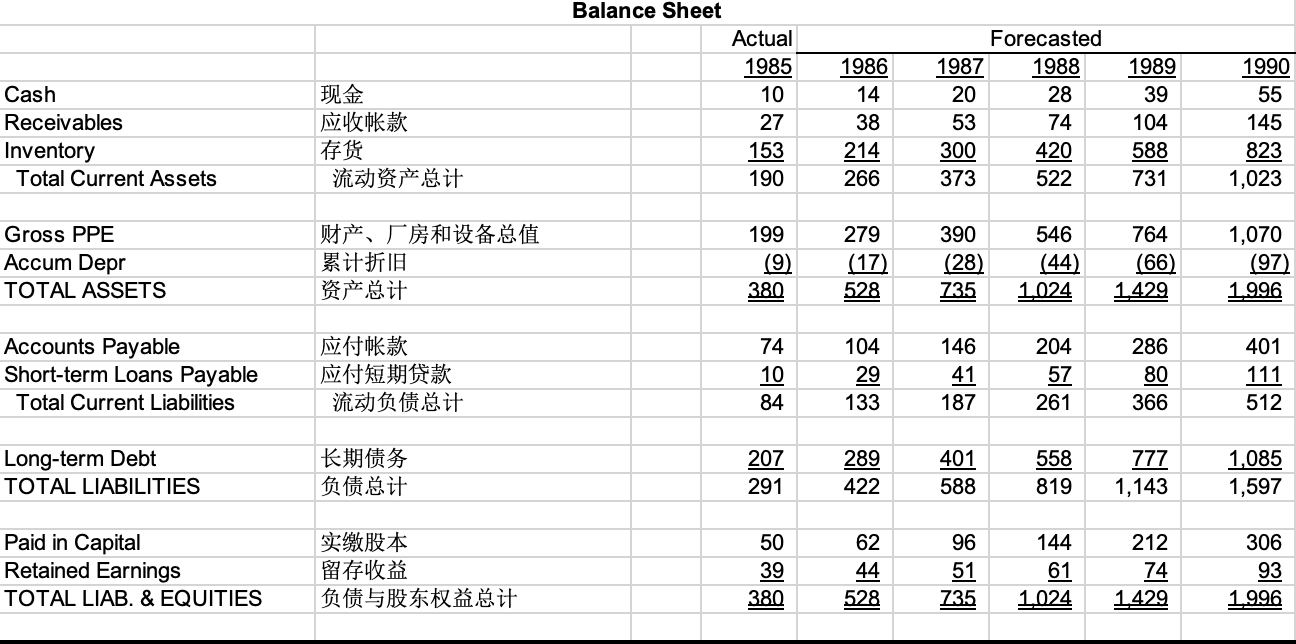
1. Will banks loan Home Depot an additional $75 million? (it appears that Home Depot will need approximately $75 million to finance its 1986 expansion plans. As of the beginning of fiscal 1986, would you loan Home Depot $75 million? Note: The numbers in the spreadsheet are in millions. The loan would replace existing long-term debt, so the total long-term as indicated in the spreadsheet would not change.)
2. What is Home Depots BIGGEST problem?
3. What are your recommendations to FIX Home Depot?
Students will be evaluated based on the quality of their answers. Questions 1 is a yes or no question (15 seconds max). Question 2 should be limited to 1 specific thing (30 seconds). The remainder of the time should be spent answering question 3.
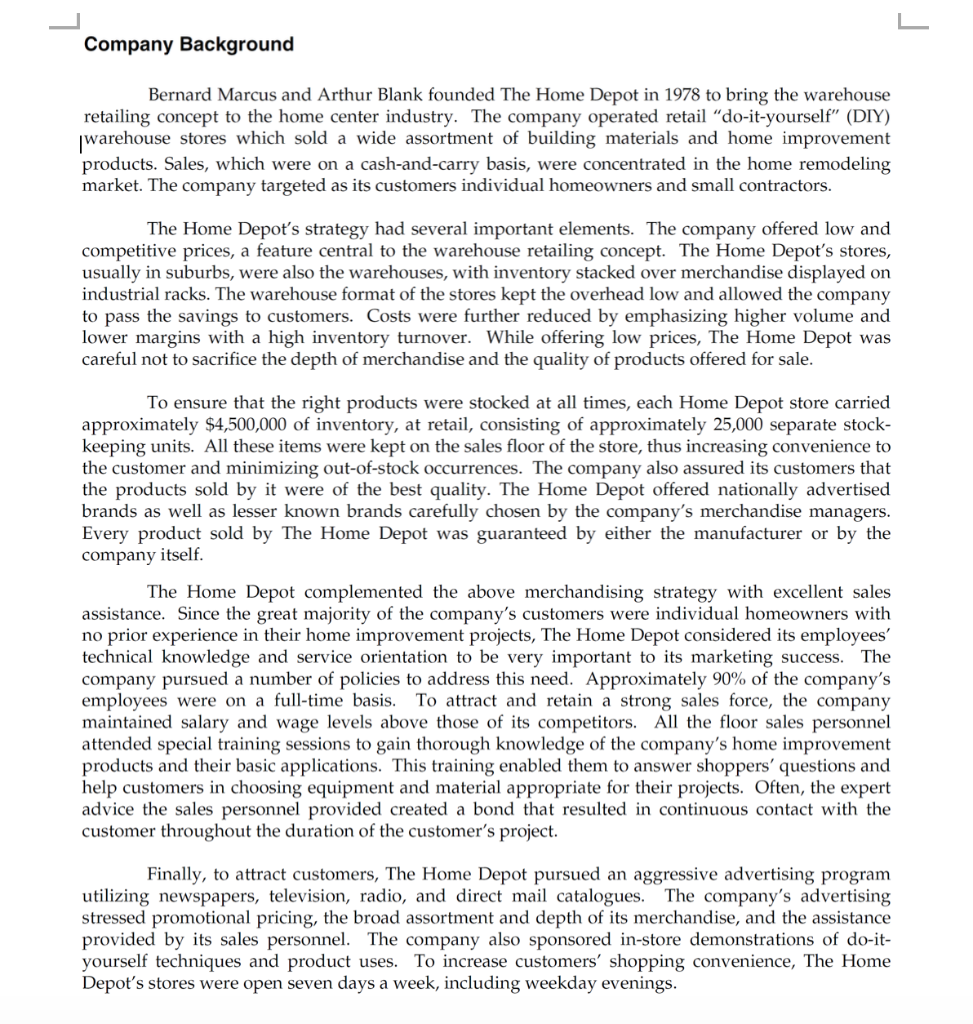
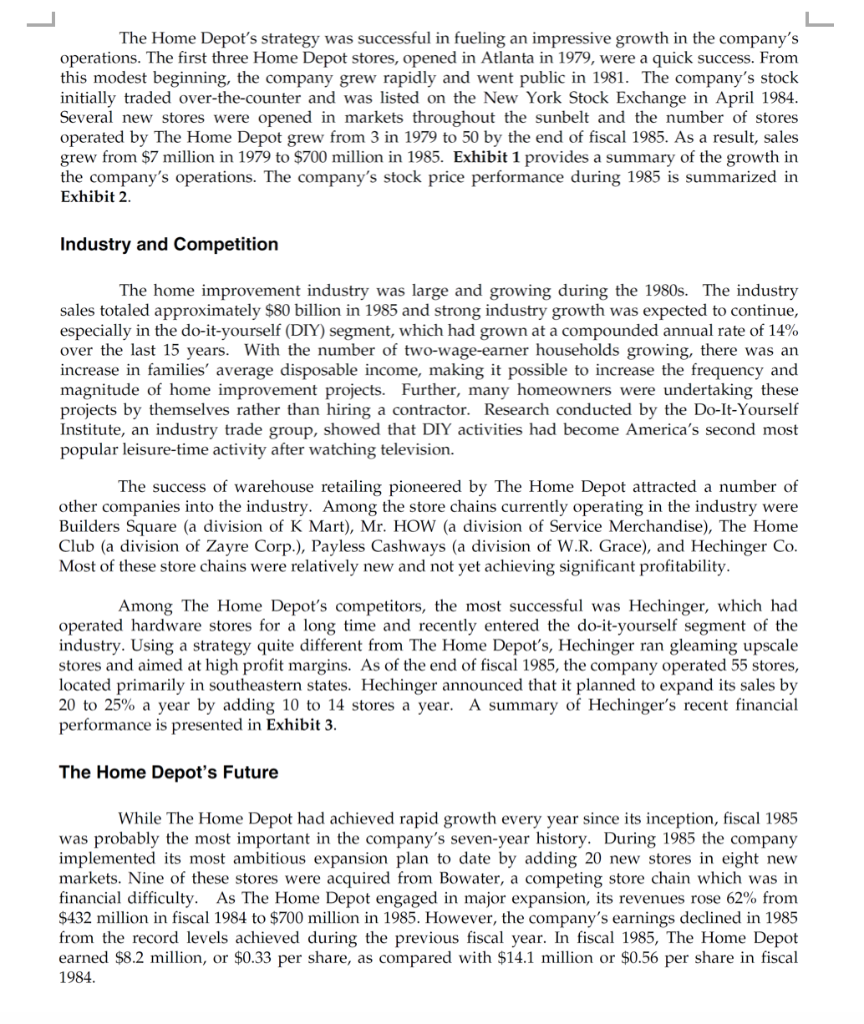
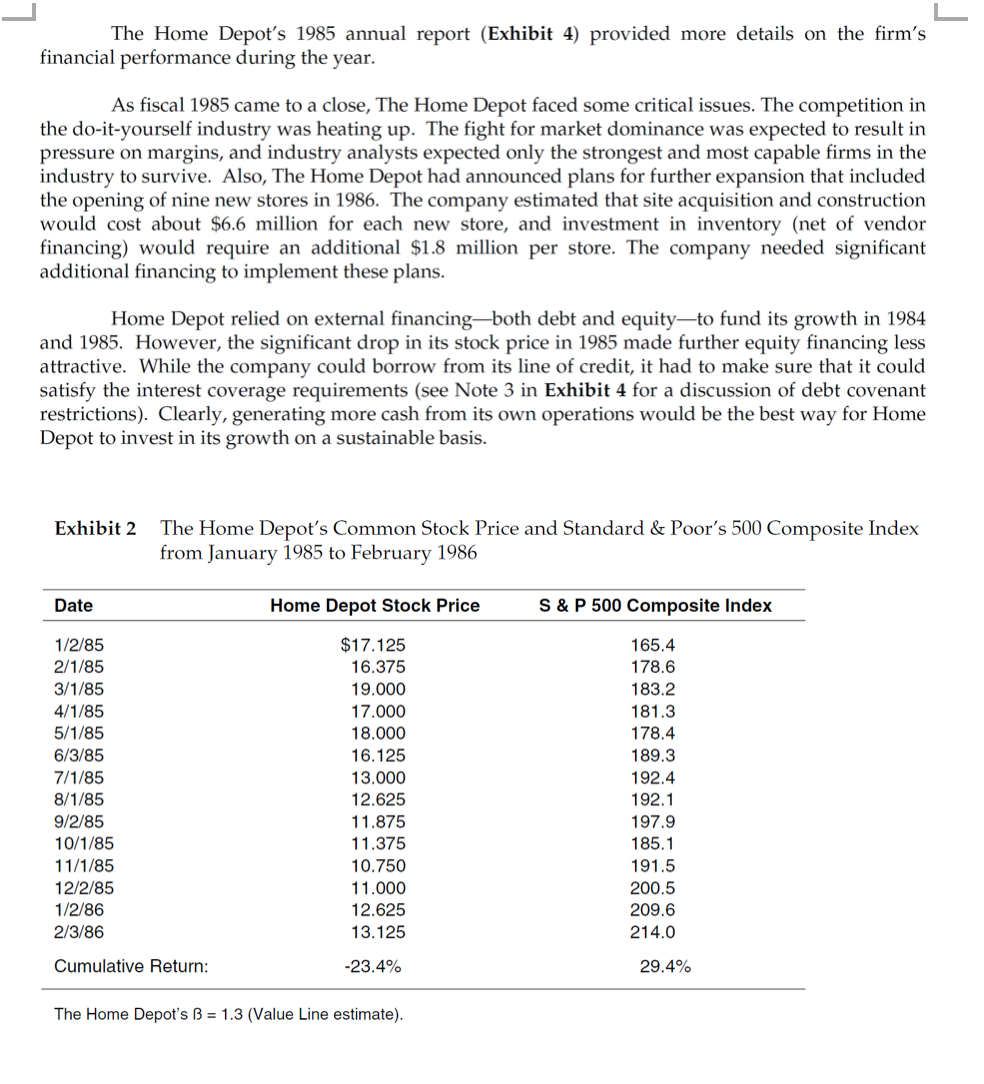
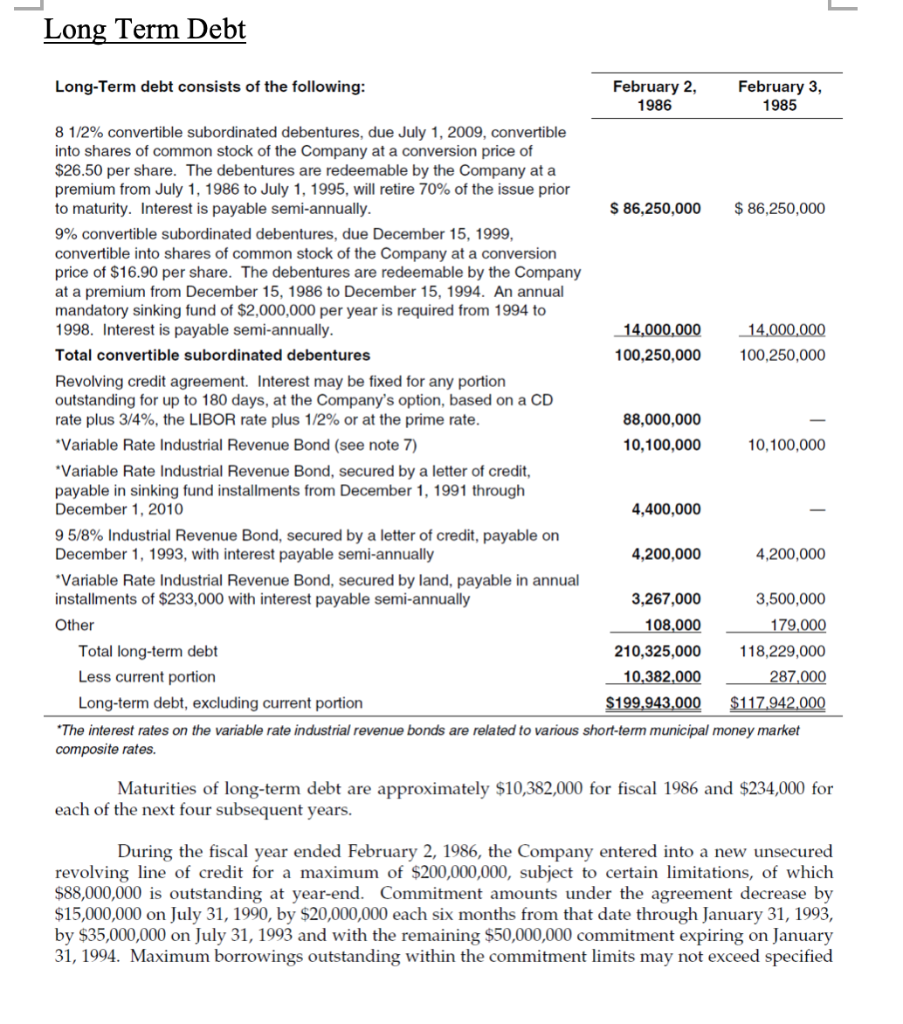
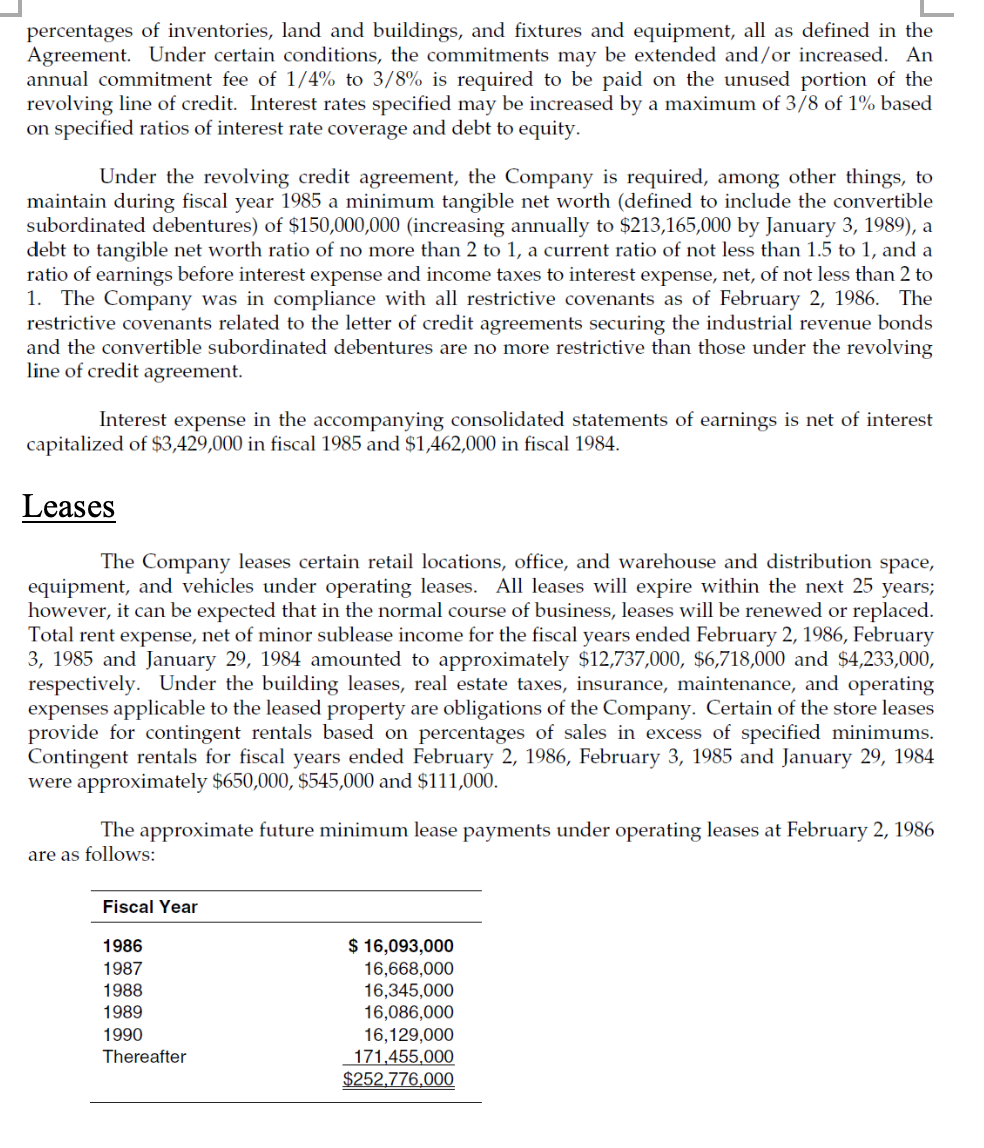
Company Background Bernard Marcus and Arthur Blank founded The Home Depot in 1978 to bring the warehouse retailing concept to the home center industry. The company operated retail "do-it-yourself" (DIY) warehouse stores which sold a wide assortment of building materials and home improvement products. Sales, which were on a cash-and-carry basis, were concentrated in the home remodeling market. The company targeted as its customers individual homeowners and small contractors. The Home Depot's strategy had several important elements. The company offered low and competitive prices, a feature central to the warehouse retailing concept. The Home Depot's stores, usually in suburbs, were also the warehouses, with inventory stacked over merchandise displayed on industrial racks. The warehouse format of the stores kept the overhead low and allowed the company to pass the savings to customers. Costs were further reduced by emphasizing higher volume and lower margins with a high inventory turnover. While offering low prices, The Home Depot was careful not to sacrifice the depth of merchandise and the quality of products offered for sale. To ensure that the right products were stocked at all times, each Home Depot store carried approximately $4,500,000 of inventory, at retail, consisting of approximately 25,000 separate stock- keeping units. All these items were kept on the sales floor of the store, thus increasing convenience to the customer and minimizing out-of-stock occurrences. The company also assured its customers that the products sold by it were of the best quality. The Home Depot offered nationally advertised brands as well as lesser known brands carefully chosen by the company's merchandise managers. Every product sold by The Home Depot was guaranteed by either the manufacturer or by the company itself. The Home Depot complemented the above merchandising strategy with excellent sales assistance. Since the great majority of the company's customers were individual homeowners with no prior experience in their home improvement projects, The Home Depot considered its employees' technical knowledge and service orientation to be very important to its marketing success. The company pursued a number of policies to address this need. Approximately 90% of the company's employees were on a full-time basis. To attract and retain a strong sales force, the company maintained salary and wage levels above those of its competitors. All the floor sales personnel attended special training sessions to gain thorough knowledge of the company's home improvement products and their basic applications. This training enabled them to answer shoppers' questions and help customers in choosing equipment and material appropriate for their projects. Often, the expert advice the sales personnel provided created a bond that resulted in continuous contact with the customer throughout the duration of the customer's project. Finally, to attract customers, The Home Depot pursued an aggressive advertising program utilizing newspapers, television, radio, and direct mail catalogues. The company's advertising stressed promotional pricing, the broad assortment and depth of its merchandise, and the assistance provided by its sales personnel. The company also sponsored in-store demonstrations of do-it- yourself techniques and product uses. To increase customers' shopping convenience, The Home Depot's stores were open seven days a week, including weekday evenings. The Home Depot's strategy was successful in fueling an impressive growth in the company's operations. The first three Home Depot stores, opened in Atlanta in 1979, were a quick success. From this modest beginning, the company grew rapidly and went public in 1981. The company's stock initially traded over-the-counter and was listed on the New York Stock Exchange in April 1984. Several new stores were opened in markets throughout the sunbelt and the number of stores operated by The Home Depot grew from 3 in 1979 to 50 by the end of fiscal 1985. As a result, sales grew from $7 million in 1979 to $700 million in 1985. Exhibit 1 provides a summary of the growth in the company's operations. The company's stock price performance during 1985 is summarized in Exhibit 2. Industry and Competition The home improvement industry was large and growing during the 1980s. The industry sales totaled approximately $80 billion in 1985 and strong industry growth was expected to continue, especially in the do-it-yourself (DIY) segment, which had grown at a compounded annual rate of 14% over the last 15 years. With the number of two-wage-earner households growing, there was an increase in families' average disposable income, making it possible to increase the frequency and magnitude of home improvement projects. Further, many homeowners were undertaking these projects by themselves rather than hiring a contractor. Research conducted by the Do-It-Yourself Institute, an industry trade group, showed that DIY activities had become America's second most popular leisure time activity after watching television. The success of warehouse retailing pioneered by The Home Depot attracted a number of other companies into the industry. Among the store chains currently operating in the industry were Builders Square (a division of K Mart), Mr. HOW (a division of Service Merchandise), The Home Club (a division of Zayre Corp.), Payless Cashways (a division of W.R. Grace), and Hechinger Co. Most of these store chains were relatively new and not yet achieving significant profitability. Among The Home Depot's competitors, the most successful was Hechinger, which had operated hardware stores for a long time and recently entered the do-it-yourself segment of the industry. Using a strategy quite different from The Home Depot's, Hechinger ran gleaming upscale stores and aimed at high profit margins. As of the end of fiscal 1985, the company operated 55 stores, located primarily in southeastern states. Hechinger announced that it planned to expand its sales by 20 to 25% a year by adding 10 to 14 stores a year. A summary of Hechinger's recent financial performance is presented in Exhibit 3. The Home Depot's Future While The Home Depot had achieved rapid growth every year since its inception, fiscal 1985 was probably the most important in the company's seven-year history. During 1985 the company implemented its most ambitious expansion plan to date by adding 20 new stores in eight new markets. Nine of these stores were acquired from Bowater, a competing store chain which was in financial difficulty. As The Home Depot engaged in major expansion, its revenues rose 62% from $432 million in fiscal 1984 to $700 million in 1985. However, the company's earnings declined in 1985 from the record levels achieved during the previous fiscal year. In fiscal 1985, The Home Depot earned $8.2 million, or $0.33 per share, as compared with $14.1 million or $0.56 per share in fiscal 1984. The Home Depot's 1985 annual report (Exhibit 4) provided more details on the firm's financial performance during the year. As fiscal 1985 came to a close, The Home Depot faced some critical issues. The competition in the do-it-yourself industry was heating up. The fight for market dominance was expected to result in pressure on margins, and industry analysts expected only the strongest and most capable firms in the industry to survive. Also, The Home Depot had announced plans for further expansion that included the opening of nine new stores in 1986. The company estimated that site acquisition and construction would cost about $6.6 million for each new store, and investment in inventory (net of vendor financing) would require an additional $1.8 million per store. The company needed significant additional financing to implement these plans. Home Depot relied on external financingboth debt and equityto fund its growth in 1984 and 1985. However, the significant drop in its stock price in 1985 made further equity financing less attractive. While the company could borrow from its line of credit, it had to make sure that it could satisfy the interest coverage requirements (see Note 3 in Exhibit 4 for a discussion of debt covenant restrictions). Clearly, generating more cash from its own operations would be the best way for Home Depot to invest in its growth on a sustainable basis. Exhibit 2 The Home Depot's Common Stock Price and Standard & Poor's 500 Composite Index from January 1985 to February 1986 Date Home Depot Stock Price S&P 500 Composite Index 1/2/85 2/1/85 3/1/85 4/1/85 5/1/85 6/3/85 7/1/85 8/1/85 9/2/85 10/1/85 11/1/85 12/2/85 1/2/86 2/3/86 $17.125 16.375 19.000 17.000 18.000 16.125 13.000 12.625 11.875 11.375 10.750 11.000 12.625 13.125 165.4 178.6 183.2 181.3 178.4 189.3 192.4 192.1 197.9 185.1 191.5 200.5 209.6 214.0 Cumulative Return: -23.4% 29.4% The Home Depot's B = 1.3 (Value Line estimate). Selected Financial Data February 2, 1986 February 3, 1985(1) Fiscal Year Ended January 29, 1984 January 30, 1983 January 31, 1982 $432,779,000 114,319,000 $256,184,000 70,014,000 $117,645,000 33,358,000 $51,542,000 14,735,000 Selected Consolidated Statement of Earnings Data: Net sales $700,729,000 Gross Profit 181,457,000 Earnings before income taxes and extraordinary item 11,619,000 Earnings before extraordinary item 8,219,000 Extraordinary item-reduction of income taxes arising from carryforward of prior years operating losses Net earnings $8,219,000 26,252,000 14,122,000 18,986,000 10,261,000 9,870,000 5,315,000 1,963,000 1,211,000 234,000 $1,445,000 $14,122,000 $10,261,000 $5,315,000 $.33 $.56 $.41 $.24 Per Common and Common Equivalent Share: Earnings before extraordinary item Extraordinary item Net earnings $.33 Weighted average number of common and common equivalent shares 25.247.000 $.06 .01 $.07 $.56 $.41 $.24 25.302.000 24.834,000 22,233,000 21,050,000 Selected Consolidated Balance Sheet Data: Working Capital $ 106,451,000 Total assets 380,193,000 Long-term debt 199,943,000 Stockholders' equity 89,092,000 $100,110,000 249,364,000 117,942,000 80,214,000 $ 49,318,000 105,230,000 4,384,000 65,278,000 $ 12,901,000 33,014,000 236,000 18,354,000 $ 5,502,000 16,906,000 3,738,000 5,024,000 (1) 53 week fiscal year, all others were 52 week fiscal years. Management Discussion and Analysis of Results of Operations and Financial Condition The data below reflect the percentage relationship between sales and major categories in the Consolidated Statements of Earnings and selected sales data of the percentage change in the dollar amounts of each of the items. Fiscal Year (a) Percentage Increase (Decrease) of Dollar Amounts 1985 v 1984 v 1984 1983 1985 1984 1983 100.0% 25.9 100.0% 26.4 100.0% 27.3 61.9% 58.7 68.9% 63.3 17.2 Selected Consolidated Statements of Earnings Data: Net sales Gross profit Cost and expenses: Selling and store operating Preopening General and administrative Net gain on disposition of property and equipment Interest income Interest expense 19.2 1.1 2.9 (-2) 17.0 .9 2.9 80.5 292.3 60.4 71.1 (21.9) 73.8 (2) (1.2) (.9) 116.2 3,863.5 1.4 72.6 24.2 1.7 20.3 6.1 2.8 3.3% Earnings before income taxes Income taxes Net earnings (71.7) 147.6 92.9 (55.7) (72.0) (41.8%) 19.9 7.4 3.4 4.0% 38.3 39.0 37.6% 1.2% Selected Consolidated Sales Data: Number of customer transactions Average amount of sale per transaction Weighted average weekly sales per operating store 23,324,000 $ 30.04 $ 342,500 14,256,000 $ 30.36 $365,500 8,479.000 $ 30.21 $360,300 63.6% (1.1) (6.3) 68.1% .5 1.4 (a) Fiscal years 1985, 1984 and 1983 refer to the fiscal years ended February 2, 1986, February 3, 1985 and January 29, 1984, respectively. Fiscal 1984 consisted of 53 weeks while 1985 and 1983 each consisted of 52 weeks. Results of Operations For an understanding of the significant factors that influenced the Company's performance during the past three fiscal years, the following discussion should be read in conjunction with the consolidated financial statements appearing elsewhere in this annual report. Fiscal Year Ended February 2, 1986 Compared to February 3, 1985 Net sales in fiscal year 1985 increased 62% from $432,779,000 to $700,729,000. The growth is attributable to several factors. First, the Company opened 20 new stores during 1985 and closed one store. Second, second-year sales increases were realized from the three new stores opened in 1984 and from the nine former Bowater Home Center stores acquired during 1984. Third, comparable store sales increases of 2.3% were achieved despite comparing the 52-week 1985 fiscal year to the sales of the 53-week 1984 fiscal year, due in part to the number of customer transactions increasing by 64%. Finally, the weighted average weekly sales per operating store declined 6% in 1985 due to the significant increase in the ratio of the number of new stores to total stores in operationnew stores have a lower sales rate than mature stores until they establish market share. Gross profit in 1985 increased 59% from $114,319,000 to $181,457,000. This increase was due to the increased sales and was partially offset by a reduction in the gross profit margin from 26.4% to 25.9%. The reduction is primarily due to lower margins achieved while establishing market presence in new markets. Cost and expenses increased 93% during 1985 and, as a percent of sales, increased from 20.3% to 24.2%. The increase in selling and store operating, preopening expenses and net interest expense is due to the opening of 20 new stores, the costs associated with the former Bowater Home Center stores, and the related cost of building market share. The large percentage of new stores which have lower sales but fixed occupancy and certain minimum operating expenses tends to cause the percentage of selling and store operating costs to increase as a percentage of sales. The net gain on disposition of property and equipment is discussed fully in note 7 to the financial statements. Earnings before income taxes decreased 56% from $26,252,000 to $11,619,000 resulting from the increase in operating expenses to support the Company's expansion program. The Company's effective income tax rate declined from 46.2% to 29.3% resulting from an increase in investment and other tax credits as a percentage of the total tax provision. As a percentage of sales, earnings decreased from 3.3% in 1984 to 1.2% in 1985 due to the increase in operating expenses as discussed above. Fiscal Year Ended February 3, 1985 Compared to January 29, 1984 Net sales in fiscal 1984 increased 69% from $256,184,000 to $432,779,000. The growth was attributable to several factors. First, the company opened three new stores during fiscal 1984. Second, the Company had sales of $9,755,000 from the nine former Bowater Home Center stores acquired on December 3, 1984. Third, second-year sales increases were realized from the nine stores opened during fiscal 1983. Fourth, comparable store sales increases of 14% were due in part to 53 weeks in fiscal 1984 compared to 52 weeks in fiscal 1983 and in part to the number of customer transactions increasing by 63%. Finally, excluding the sales of the former Bowater Home Center stores, the weighted average weekly sales per operating store increased 6% to $383,500 in fiscal 1984. Gross profit in fiscal 1984 increased 63% from $70,014,000 to $114,319,000. This net increase was due to the increased sales and was partially offset by a reduction in the gross profit margin from 27.3% to 26.4%. The reduction in the gross profit percentage is largely the result of the purchase of a high proportion of promoted merchandise by customers in the second quarter. Costs and expenses increased 73% during fiscal 1984. As a percent of sales, costs and expenses increased from 19.9% to 20.3% due to increased selling, store operating, general and administrative expenses. This planned increase was in preparation of the Company's future expansion. Interest expense increased significantly as a result of the issuance of substantial debt during fiscal 1984 to fund the Company's expansion. These increases were partially offset by reduced preopening expenses and increased interest income resulting from temporary investment of the proceeds of the debt financing. Earnings before income taxes increased 38% from $18,986,000 to $26,252,000 resulting from the factors discussed above. Such pretax earnings, however, were reduced by a loss from the Bowater stores of approximately $1,900,000 from date of acquisition (December 1984) to year end. The Company's effective income tax rate increased slightly from 46.0% to 46.2% resulting principally from less investment and other tax credits as a percentage of the total tax provision. As a percentage of sales, earnings decreased from 4.0% in fiscal 1983 to 3.3% in fiscal 1984. The decline is a result of the company's reduced gross profit percentage and increases in the operating expenses discussed above. Impact of Inflation and Changing Prices Although the Company cannot accurately determine the precise effect of inflation on its operations, it does not believe inflation has had a material effect on sales or results of operations. The Company has complied with the reporting requirements of the Financial Accounting Standards Board Statement No. 33 in note 10 to the financial statements. Due to the experimental techniques, subjective estimates and assumptions, and the incomplete presentation required by this accounting pronouncement, the Company questions the value of the required reporting. Liquidity and Capital Resources Cash flow generated from existing store operations provided the Company with a significant source of liquidity since sales are on a cash-and-carry basis. In addition, a significant portion of the Company's inventory is financed under vendor credit terms. The Company has supplemented its operating cash flow from time to time with bank credit and equity and debt financing. During fiscal 1985, $88,000,000 of working capital was provided by the revolving bank credit line, $4,400,000 from industrial revenue bonds, and approximately $15,707,000 from operations. In addition, during fiscal 1985, the Company entered into a new credit agreement for a $200,000,000 revolving credit facility with a group of banks. The Company has announced plans to open nine new stores during fiscal 1986, two in the new market of northern California and the balance in existing markets. The cost of this store expansion program will depend upon, among other factors, the extent to which the Company is able to lease second-use store space as opposed to acquiring leases or sites and having stores constructed to its own specifications. The Company estimates that approximately $6,600,000 per store will be required to acquire sites and construct facilities to the Company's specifications and that approximately $1,700,000 will be required to open a store in leased space plus any additional costs of acquiring the lease. These estimates include costs for site acquisition, construction expenditures, fixtures and equipment, and in-store minicomputers and point-of-sale terminals. In addition, each new store will require approximately $1,800,000 to finance inventories, net of vendor financing. The Company believes it has the ability to finance these expenditures through existing cash resources, current bank lines of credit which include a $200,000,000 eight-year revolving credit agreement, funds generated from operations, and other forms of financing, including but not limited to various forms of real estate financing and unsecured borrowings. Long Term Debt Long-Term debt consists of the following: February 2, February 3, 1986 1985 8 1/2% convertible subordinated debentures, due July 1, 2009, convertible into shares of common stock of the Company at a conversion price of $26.50 per share. The debentures are redeemable by the Company at a premium from July 1, 1986 to July 1, 1995, will retire 70% of the issue prior to maturity. Interest is payable semi-annually. $ 86,250,000 $86,250,000 9% convertible subordinated debentures, due December 15. 1999. convertible into shares of common stock of the Company at a conversion price of $16.90 per share. The debentures are redeemable by the Company at a premium from December 15, 1986 to December 15, 1994. An annual mandatory sinking fund of $2,000,000 per year is required from 1994 to 1998. Interest is payable semi-annually. 14,000,000 14,000,000 Total convertible subordinated debentures 100,250,000 100,250,000 Revolving credit agreement. Interest may be fixed for any portion outstanding for up to 180 days, at the Company's option, based on a CD rate plus 3/4%, the LIBOR rate plus 1/2% or at the prime rate. 88,000,000 "Variable Rate Industrial Revenue Bond (see note 7) 10,100,000 10,100,000 "Variable Rate Industrial Revenue Bond, secured by a letter of credit, payable in sinking fund installments from December 1, 1991 through December 1, 2010 4,400,000 9 5/8% Industrial Revenue Bond, secured by a letter of credit, payable on December 1, 1993, with interest payable semi-annually 4,200,000 4,200,000 "Variable Rate Industrial Revenue Bond, secured by land, payable in annual installments of $233,000 with interest payable semi-annually 3,267,000 3,500,000 Other 108,000 179,000 Total long-term debt 210,325,000 118,229,000 Less current portion 10,382,000 287,000 Long-term debt, excluding current portion $199,943,000 $117.942.000 *The interest rates on the variable rate industrial revenue bonds are related to various short-term municipal money market composite rates. Maturities of long-term debt are approximately $10,382,000 for fiscal 1986 and $234,000 for each of the next four subsequent years. During the fiscal year ended February 2, 1986, the Company entered into a new unsecured revolving line of credit for a maximum of $200,000,000, subject to certain limitations, of which $88,000,000 is outstanding at year-end. Commitment amounts under the agreement decrease by $15,000,000 on July 31, 1990, by $20,000,000 each six months from that date through January 31, 1993, by $35,000,000 on July 31, 1993 and with the remaining $50,000,000 commitment expiring on January 31, 1994. Maximum borrowings outstanding within the commitment limits may not exceed specified percentages of inventories, land and buildings, and fixtures and equipment, all as defined in the Agreement. Under certain conditions, the commitments may be extended and/or increased. An annual commitment fee of 1/4% to 3/8% is required to be paid on the unused portion of the revolving line of credit. Interest rates specified may be increased by a maximum of 3/8 of 1% based on specified ratios of interest rate coverage and debt to equity. Under the revolving credit agreement, the Company is required, among other things, to maintain during fiscal year 1985 a minimum tangible net worth (defined to include the convertible subordinated debentures) of $150,000,000 (increasing annually to $213,165,000 by January 3, 1989), a debt to tangible net worth ratio of no more than 2 to 1, a current ratio of not less than 1.5 to 1, and a ratio of earnings before interest expense and income taxes to interest expense, net, of not less than 2 to 1. The Company was in compliance with all restrictive covenants as of February 2, 1986. The restrictive covenants related to the letter of credit agreements securing the industrial revenue bonds and the convertible subordinated debentures are no more restrictive than those under the revolving line of credit agreement. Interest expense in the accompanying consolidated statements of earnings is net of interest capitalized of $3,429,000 in fiscal 1985 and $1,462,000 in fiscal 1984. Leases The Company leases certain retail locations, office, and warehouse and distribution space, equipment, and vehicles under operating leases. All leases will expire within the next 25 years; however, it can be expected that in the normal course of business, leases will be renewed or replaced. Total rent expense, net of minor sublease income for the fiscal years ended February 2, 1986, February 3, 1985 and January 29, 1984 amounted to approximately $12,737,000, $6,718,000 and $4,233,000, respectively. Under the building leases, real estate taxes, insurance, maintenance, and operating expenses applicable to the leased property are obligations of the Company. Certain of the store leases provide for contingent rentals based on percentages of sales in excess of specified minimums. Contingent rentals for fiscal years ended February 2, 1986, February 3, 1985 and January 29, 1984 were approximately $650,000, $545,000 and $111,000. The approximate future minimum lease payments under operating leases at February 2, 1986 are as follows: Fiscal Year 1986 1987 1988 1989 1990 Thereafter $ 16,093,000 16,668,000 16,345,000 16,086,000 16,129,000 171,455,000 $252.776.000 Home Depot Spreadsheet 40% 1985 1986 1987 1989 5 7 13 Cash Flow from Operations Net Income Depreciation (Increase) in Receivables (Increase) in Inventories Increase in A/P 22 () () 5 (15) (68) 23 8 (11) (61) 30 | 1988 10 16 (21) (120) 11 (15) (86) 42 1990 19 31 (41) (235) 115 (30) (168) 58 2 Net Cash from Operations (47) (29) (41) (57) (81) (111) Average Collection Period # Days' Sales in Inventory Fixed Asset Turnover Gross Profit Percentage Other Op Exp / Sales Average Payable Period 14.08 107.6 3.518 25.86% 22.14% 148.34 9.06 66.2 3.989 30.00% 19.86% 50.37 - Debt Covenants Current Ratio Debt Ratio 2.0 80% | | Expected Sales Growth 40% Balance Sheet Actual 1985 10 1986 1989 139 14 28 27 Forecasted 1987 | 198 20 53 300 420 373 1522 74 Cash Receivables Inventory Total Current Assets 104 | 1990 155 145 823 1,023 138 214 266 153 190 588 731 1546 Gross PPE Accum Depr TOTAL ASSETS 199 (9) 380 279 (17) 528 390 (28) 735 (44) 1024 1764 (66) 1429 1,070 (97) 1996 104 Accounts Payable Short-term Loans Payable Total Current Liabilities 174 | 10 184 29 | 146 41 187 204 57 261 1286 80 366 401 111 1512 133 558 Long-term Debt TOTAL LIABILITIES 207 291 289 422 401 588 777 1,143 1.085 1,597 8819 196 Paid in Capital Retained Earnings TOTAL LIAB. & EQUITIES 50 139 380 162 44 528 144 212 51 74 735 | 1024 | 1429 61 306 93 1996 | 62 96 | 144 212 306 Paid in Capital Retained Earnings TOTAL LIAB. & EQUITIES | 50 39 | 380 44 51 61 93 528 Z35 74 1429 1024 1996 Statement of Retained Earnings 31 511 74 44 7 10 Beg. Retained Earnings + Net Income - Dividends End. Retained Earnings + - 39 5 0| 44| 611 13 19 0 7493 0 - 9 0| 51| 0 61 | 39 Sales Cost of Goods Sold Gross Profit Income Statement 1700 | | (519) 181 980 1,372 1,921| 2,689 (727) (1,017) (1,424) (1994) 253355| 497695 || 3,765 (2.791) 974 Depreciation Expense Other Operating Expenses Operating Profit (5) (155) (8) (217) 28 (11) (304) (16) (425) 56 (22) (595) 78 (31) (834) 109 21 40 (30) (9) (21) 1271 (80) 29 Interest Expense Income before Taxes Income Tax Expense Net Income g2qa (41) 15 (5) 10 (58) 20 (7) 13 857 1986 1987 1988 1989 1990 5 7 Statement of Cash Flows 40% 1985 Cash Flow from Operations Net Income Depreciation (Increase) in Receivables () (15) (Increase) in Inventories () (68) Increase in AP 23 Net Cash from Operations (47) | 19 31/ 5 8 (11) 11 (15) (86) 10 16 (21) (120) 13 22 (30) (168) (41) (61) 42 58 82 30 (29) (235) | 115 (111) (41) (57) (81) Cash from Investing Activities | Cash Paid for PPE Purchases , (92) (80) (111) (156) (218) (306) 19 Cash from Financing Activities | New Short-term Borrowing | New Long-term Borrowing New Investment Cash dividends paid Net Cash from Financing 12 112 34 16 157 48 82 12 0 | 113 23 219 68 | 0 310 31 308 94 0 433 0 158 221 Net Increase (Decrease) in Cash () (46) 4 6 8 11 6 Return on Equity (NI/Equity) 9.0% 4.7% 4.8% 4.9% 4.5% 4.8% Financing Needed 0 0 0 0 0 0 Short-term Loans Payable Long-term Debt Paid in Capital 6.0% 8.0% 207 50 1029415780 401 777 96 144 212 289 62 111 1,085 306 Dividends 0 000 0 0 Current Ratio (CA/CL) Debt Ratio (TL/TA) Return on Assets (EBIT/Assets) Return on Equity (NI/Equity) 2.262 .00 76.6% 79.9% 5.5% 5.3% 9.0% 4.7% 4.7% 1.99 80.0% 5.4% 4.8% 2.00 80.0% 5.5% 4.9% 2.00 80.0% 5.5% 4.5% 2.00 80.0% 5.5% 4.8% Sales 700 980 1,372 1,921 2,689 3,765 Company Background Bernard Marcus and Arthur Blank founded The Home Depot in 1978 to bring the warehouse retailing concept to the home center industry. The company operated retail "do-it-yourself" (DIY) warehouse stores which sold a wide assortment of building materials and home improvement products. Sales, which were on a cash-and-carry basis, were concentrated in the home remodeling market. The company targeted as its customers individual homeowners and small contractors. The Home Depot's strategy had several important elements. The company offered low and competitive prices, a feature central to the warehouse retailing concept. The Home Depot's stores, usually in suburbs, were also the warehouses, with inventory stacked over merchandise displayed on industrial racks. The warehouse format of the stores kept the overhead low and allowed the company to pass the savings to customers. Costs were further reduced by emphasizing higher volume and lower margins with a high inventory turnover. While offering low prices, The Home Depot was careful not to sacrifice the depth of merchandise and the quality of products offered for sale. To ensure that the right products were stocked at all times, each Home Depot store carried approximately $4,500,000 of inventory, at retail, consisting of approximately 25,000 separate stock- keeping units. All these items were kept on the sales floor of the store, thus increasing convenience to the customer and minimizing out-of-stock occurrences. The company also assured its customers that the products sold by it were of the best quality. The Home Depot offered nationally advertised brands as well as lesser known brands carefully chosen by the company's merchandise managers. Every product sold by The Home Depot was guaranteed by either the manufacturer or by the company itself. The Home Depot complemented the above merchandising strategy with excellent sales assistance. Since the great majority of the company's customers were individual homeowners with no prior experience in their home improvement projects, The Home Depot considered its employees' technical knowledge and service orientation to be very important to its marketing success. The company pursued a number of policies to address this need. Approximately 90% of the company's employees were on a full-time basis. To attract and retain a strong sales force, the company maintained salary and wage levels above those of its competitors. All the floor sales personnel attended special training sessions to gain thorough knowledge of the company's home improvement products and their basic applications. This training enabled them to answer shoppers' questions and help customers in choosing equipment and material appropriate for their projects. Often, the expert advice the sales personnel provided created a bond that resulted in continuous contact with the customer throughout the duration of the customer's project. Finally, to attract customers, The Home Depot pursued an aggressive advertising program utilizing newspapers, television, radio, and direct mail catalogues. The company's advertising stressed promotional pricing, the broad assortment and depth of its merchandise, and the assistance provided by its sales personnel. The company also sponsored in-store demonstrations of do-it- yourself techniques and product uses. To increase customers' shopping convenience, The Home Depot's stores were open seven days a week, including weekday evenings. The Home Depot's strategy was successful in fueling an impressive growth in the company's operations. The first three Home Depot stores, opened in Atlanta in 1979, were a quick success. From this modest beginning, the company grew rapidly and went public in 1981. The company's stock initially traded over-the-counter and was listed on the New York Stock Exchange in April 1984. Several new stores were opened in markets throughout the sunbelt and the number of stores operated by The Home Depot grew from 3 in 1979 to 50 by the end of fiscal 1985. As a result, sales grew from $7 million in 1979 to $700 million in 1985. Exhibit 1 provides a summary of the growth in the company's operations. The company's stock price performance during 1985 is summarized in Exhibit 2. Industry and Competition The home improvement industry was large and growing during the 1980s. The industry sales totaled approximately $80 billion in 1985 and strong industry growth was expected to continue, especially in the do-it-yourself (DIY) segment, which had grown at a compounded annual rate of 14% over the last 15 years. With the number of two-wage-earner households growing, there was an increase in families' average disposable income, making it possible to increase the frequency and magnitude of home improvement projects. Further, many homeowners were undertaking these projects by themselves rather than hiring a contractor. Research conducted by the Do-It-Yourself Institute, an industry trade group, showed that DIY activities had become America's second most popular leisure time activity after watching television. The success of warehouse retailing pioneered by The Home Depot attracted a number of other companies into the industry. Among the store chains currently operating in the industry were Builders Square (a division of K Mart), Mr. HOW (a division of Service Merchandise), The Home Club (a division of Zayre Corp.), Payless Cashways (a division of W.R. Grace), and Hechinger Co. Most of these store chains were relatively new and not yet achieving significant profitability. Among The Home Depot's competitors, the most successful was Hechinger, which had operated hardware stores for a long time and recently entered the do-it-yourself segment of the industry. Using a strategy quite different from The Home Depot's, Hechinger ran gleaming upscale stores and aimed at high profit margins. As of the end of fiscal 1985, the company operated 55 stores, located primarily in southeastern states. Hechinger announced that it planned to expand its sales by 20 to 25% a year by adding 10 to 14 stores a year. A summary of Hechinger's recent financial performance is presented in Exhibit 3. The Home Depot's Future While The Home Depot had achieved rapid growth every year since its inception, fiscal 1985 was probably the most important in the company's seven-year history. During 1985 the company implemented its most ambitious expansion plan to date by adding 20 new stores in eight new markets. Nine of these stores were acquired from Bowater, a competing store chain which was in financial difficulty. As The Home Depot engaged in major expansion, its revenues rose 62% from $432 million in fiscal 1984 to $700 million in 1985. However, the company's earnings declined in 1985 from the record levels achieved during the previous fiscal year. In fiscal 1985, The Home Depot earned $8.2 million, or $0.33 per share, as compared with $14.1 million or $0.56 per share in fiscal 1984. The Home Depot's 1985 annual report (Exhibit 4) provided more details on the firm's financial performance during the year. As fiscal 1985 came to a close, The Home Depot faced some critical issues. The competition in the do-it-yourself industry was heating up. The fight for market dominance was expected to result in pressure on margins, and industry analysts expected only the strongest and most capable firms in the industry to survive. Also, The Home Depot had announced plans for further expansion that included the opening of nine new stores in 1986. The company estimated that site acquisition and construction would cost about $6.6 million for each new store, and investment in inventory (net of vendor financing) would require an additional $1.8 million per store. The company needed significant additional financing to implement these plans. Home Depot relied on external financingboth debt and equityto fund its growth in 1984 and 1985. However, the significant drop in its stock price in 1985 made further equity financing less attractive. While the company could borrow from its line of credit, it had to make sure that it could satisfy the interest coverage requirements (see Note 3 in Exhibit 4 for a discussion of debt covenant restrictions). Clearly, generating more cash from its own operations would be the best way for Home Depot to invest in its growth on a sustainable basis. Exhibit 2 The Home Depot's Common Stock Price and Standard & Poor's 500 Composite Index from January 1985 to February 1986 Date Home Depot Stock Price S&P 500 Composite Index 1/2/85 2/1/85 3/1/85 4/1/85 5/1/85 6/3/85 7/1/85 8/1/85 9/2/85 10/1/85 11/1/85 12/2/85 1/2/86 2/3/86 $17.125 16.375 19.000 17.000 18.000 16.125 13.000 12.625 11.875 11.375 10.750 11.000 12.625 13.125 165.4 178.6 183.2 181.3 178.4 189.3 192.4 192.1 197.9 185.1 191.5 200.5 209.6 214.0 Cumulative Return: -23.4% 29.4% The Home Depot's B = 1.3 (Value Line estimate). Selected Financial Data February 2, 1986 February 3, 1985(1) Fiscal Year Ended January 29, 1984 January 30, 1983 January 31, 1982 $432,779,000 114,319,000 $256,184,000 70,014,000 $117,645,000 33,358,000 $51,542,000 14,735,000 Selected Consolidated Statement of Earnings Data: Net sales $700,729,000 Gross Profit 181,457,000 Earnings before income taxes and extraordinary item 11,619,000 Earnings before extraordinary item 8,219,000 Extraordinary item-reduction of income taxes arising from carryforward of prior years operating losses Net earnings $8,219,000 26,252,000 14,122,000 18,986,000 10,261,000 9,870,000 5,315,000 1,963,000 1,211,000 234,000 $1,445,000 $14,122,000 $10,261,000 $5,315,000 $.33 $.56 $.41 $.24 Per Common and Common Equivalent Share: Earnings before extraordinary item Extraordinary item Net earnings $.33 Weighted average number of common and common equivalent shares 25.247.000 $.06 .01 $.07 $.56 $.41 $.24 25.302.000 24.834,000 22,233,000 21,050,000 Selected Consolidated Balance Sheet Data: Working Capital $ 106,451,000 Total assets 380,193,000 Long-term debt 199,943,000 Stockholders' equity 89,092,000 $100,110,000 249,364,000 117,942,000 80,214,000 $ 49,318,000 105,230,000 4,384,000 65,278,000 $ 12,901,000 33,014,000 236,000 18,354,000 $ 5,502,000 16,906,000 3,738,000 5,024,000 (1) 53 week fiscal year, all others were 52 week fiscal years. Management Discussion and Analysis of Results of Operations and Financial Condition The data below reflect the percentage relationship between sales and major categories in the Consolidated Statements of Earnings and selected sales data of the percentage change in the dollar amounts of each of the items. Fiscal Year (a) Percentage Increase (Decrease) of Dollar Amounts 1985 v 1984 v 1984 1983 1985 1984 1983 100.0% 25.9 100.0% 26.4 100.0% 27.3 61.9% 58.7 68.9% 63.3 17.2 Selected Consolidated Statements of Earnings Data: Net sales Gross profit Cost and expenses: Selling and store operating Preopening General and administrative Net gain on disposition of property and equipment Interest income Interest expense 19.2 1.1 2.9 (-2) 17.0 .9 2.9 80.5 292.3 60.4 71.1 (21.9) 73.8 (2) (1.2) (.9) 116.2 3,863.5 1.4 72.6 24.2 1.7 20.3 6.1 2.8 3.3% Earnings before income taxes Income taxes Net earnings (71.7) 147.6 92.9 (55.7) (72.0) (41.8%) 19.9 7.4 3.4 4.0% 38.3 39.0 37.6% 1.2% Selected Consolidated Sales Data: Number of customer transactions Average amount of sale per transaction Weighted average weekly sales per operating store 23,324,000 $ 30.04 $ 342,500 14,256,000 $ 30.36 $365,500 8,479.000 $ 30.21 $360,300 63.6% (1.1) (6.3) 68.1% .5 1.4 (a) Fiscal years 1985, 1984 and 1983 refer to the fiscal years ended February 2, 1986, February 3, 1985 and January 29, 1984, respectively. Fiscal 1984 consisted of 53 weeks while 1985 and 1983 each consisted of 52 weeks. Results of Operations For an understanding of the significant factors that influenced the Company's performance during the past three fiscal years, the following discussion should be read in conjunction with the consolidated financial statements appearing elsewhere in this annual report. Fiscal Year Ended February 2, 1986 Compared to February 3, 1985 Net sales in fiscal year 1985 increased 62% from $432,779,000 to $700,729,000. The growth is attributable to several factors. First, the Company opened 20 new stores during 1985 and closed one store. Second, second-year sales increases were realized from the three new stores opened in 1984 and from the nine former Bowater Home Center stores acquired during 1984. Third, comparable store sales increases of 2.3% were achieved despite comparing the 52-week 1985 fiscal year to the sales of the 53-week 1984 fiscal year, due in part to the number of customer transactions increasing by 64%. Finally, the weighted average weekly sales per operating store declined 6% in 1985 due to the significant increase in the ratio of the number of new stores to total stores in operationnew stores have a lower sales rate than mature stores until they establish market share. Gross profit in 1985 increased 59% from $114,319,000 to $181,457,000. This increase was due to the increased sales and was partially offset by a reduction in the gross profit margin from 26.4% to 25.9%. The reduction is primarily due to lower margins achieved while establishing market presence in new markets. Cost and expenses increased 93% during 1985 and, as a percent of sales, increased from 20.3% to 24.2%. The increase in selling and store operating, preopening expenses and net interest expense is due to the opening of 20 new stores, the costs associated with the former Bowater Home Center stores, and the related cost of building market share. The large percentage of new stores which have lower sales but fixed occupancy and certain minimum operating expenses tends to cause the percentage of selling and store operating costs to increase as a percentage of sales. The net gain on disposition of property and equipment is discussed fully in note 7 to the financial statements. Earnings before income taxes decreased 56% from $26,252,000 to $11,619,000 resulting from the increase in operating expenses to support the Company's expansion program. The Company's effective income tax rate declined from 46.2% to 29.3% resulting from an increase in investment and other tax credits as a percentage of the total tax provision. As a percentage of sales, earnings decreased from 3.3% in 1984 to 1.2% in 1985 due to the increase in operating expenses as discussed above. Fiscal Year Ended February 3, 1985 Compared to January 29, 1984 Net sales in fiscal 1984 increased 69% from $256,184,000 to $432,779,000. The growth was attributable to several factors. First, the company opened three new stores during fiscal 1984. Second, the Company had sales of $9,755,000 from the nine former Bowater Home Center stores acquired on December 3, 1984. Third, second-year sales increases were realized from the nine stores opened during fiscal 1983. Fourth, comparable store sales increases of 14% were due in part to 53 weeks in fiscal 1984 compared to 52 weeks in fiscal 1983 and in part to the number of customer transactions increasing by 63%. Finally, excluding the sales of the former Bowater Home Center stores, the weighted average weekly sales per operating store increased 6% to $383,500 in fiscal 1984. Gross profit in fiscal 1984 increased 63% from $70,014,000 to $114,319,000. This net increase was due to the increased sales and was partially offset by a reduction in the gross profit margin from 27.3% to 26.4%. The reduction in the gross profit percentage is largely the result of the purchase of a high proportion of promoted merchandise by customers in the second quarter. Costs and expenses increased 73% during fiscal 1984. As a percent of sales, costs and expenses increased from 19.9% to 20.3% due to increased selling, store operating, general and administrative expenses. This planned increase was in preparation of the Company's future expansion. Interest expense increased significantly as a result of the issuance of substantial debt during fiscal 1984 to fund the Company's expansion. These increases were partially offset by reduced preopening expenses and increased interest income resulting from temporary investment of the proceeds of the debt financing. Earnings before income taxes increased 38% from $18,986,000 to $26,252,000 resulting from the factors discussed above. Such pretax earnings, however, were reduced by a loss from the Bowater stores of approximately $1,900,000 from date of acquisition (December 1984) to year end. The Company's effective income tax rate increased slightly from 46.0% to 46.2% resulting principally from less investment and other tax credits as a percentage of the total tax provision. As a percentage of sales, earnings decreased from 4.0% in fiscal 1983 to 3.3% in fiscal 1984. The decline is a result of the company's reduced gross profit percentage and increases in the operating expenses discussed above. Impact of Inflation and Changing Prices Although the Company cannot accurately determine the precise effect of inflation on its operations, it does not believe inflation has had a material effect on sales or results of operations. The Company has complied with the reporting requirements of the Financial Accounting Standards Board Statement No. 33 in note 10 to the financial statements. Due to the experimental techniques, subjective estimates and assumptions, and the incomplete presentation required by this accounting pronouncement, the Company questions the value of the required reporting. Liquidity and Capital Resources Cash flow generated from existing store operations provided the Company with a significant source of liquidity since sales are on a cash-and-carry basis. In addition, a significant portion of the Company's inventory is financed under vendor credit terms. The Company has supplemented its operating cash flow from time to time with bank credit and equity and debt financing. During fiscal 1985, $88,000,000 of working capital was provided by the revolving bank credit line, $4,400,000 from industrial revenue bonds, and approximately $15,707,000 from operations. In addition, during fiscal 1985, the Company entered into a new credit agreement for a $200,000,000 revolving credit facility with a group of banks. The Company has announced plans to open nine new stores during fiscal 1986, two in the new market of northern California and the balance in existing markets. The cost of this store expansion program will depend upon, among other factors, the extent to which the Company is able to lease second-use store space as opposed to acquiring leases or sites and having stores constructed to its own specifications. The Company estimates that approximately $6,600,000 per store will be required to acquire sites and construct facilities to the Company's specifications and that approximately $1,700,000 will be required to open a store in leased space plus any additional costs of acquiring the lease. These estimates include costs for site acquisition, construction expenditures, fixtures and equipment, and in-store minicomputers and point-of-sale terminals. In addition, each new store will require approximately $1,800,000 to finance inventories, net of vendor financing. The Company believes it has the ability to finance these expenditures through existing cash resources, current bank lines of credit which include a $200,000,000 eight-year revolving credit agreement, funds generated from operations, and other forms of financing, including but not limited to various forms of real estate financing and unsecured borrowings. Long Term Debt Long-Term debt consists of the following: February 2, February 3, 1986 1985 8 1/2% convertible subordinated debentures, due July 1, 2009, convertible into shares of common stock of the Company at a conversion price of $26.50 per share. The debentures are redeemable by the Company at a premium from July 1, 1986 to July 1, 1995, will retire 70% of the issue prior to maturity. Interest is payable semi-annually. $ 86,250,000 $86,250,000 9% convertible subordinated debentures, due December 15. 1999. convertible into shares of common stock of the Company at a conversion price of $16.90 per share. The debentures are redeemable by the Company at a premium from December 15, 1986 to December 15, 1994. An annual mandatory sinking fund of $2,000,000 per year is required from 1994 to 1998. Interest is payable semi-annually. 14,000,000 14,000,000 Total convertible subordinated debentures 100,250,000 100,250,000 Revolving credit agreement. Interest may be fixed for any portion outstanding for up to 180 days, at the Company's option, based on a CD rate plus 3/4%, the LIBOR rate plus 1/2% or at the prime rate. 88,000,000 "Variable Rate Industrial Revenue Bond (see note 7) 10,100,000 10,100,000 "Variable Rate Industrial Revenue Bond, secured by a letter of credit, payable in sinking fund installments from December 1, 1991 through December 1, 2010 4,400,000 9 5/8% Industrial Revenue Bond, secured by a letter of credit, payable on December 1, 1993, with interest payable semi-annually 4,200,000 4,200,000 "Variable Rate Industrial Revenue Bond, secured by land, payable in annual installments of $233,000 with interest payable semi-annually 3,267,000 3,500,000 Other 108,000 179,000 Total long-term debt 210,325,000 118,229,000 Less current portion 10,382,000 287,000 Long-term debt, excluding current portion $199,943,000 $117.942.000 *The interest rates on the variable rate industrial revenue bonds are related to various short-term municipal money market composite rates. Maturities of long-term debt are approximately $10,382,000 for fiscal 1986 and $234,000 for each of the next four subsequent years. During the fiscal year ended February 2, 1986, the Company entered into a new unsecured revolving line of credit for a maximum of $200,000,000, subject to certain limitations, of which $88,000,000 is outstanding at year-end. Commitment amounts under the agreement decrease by $15,000,000 on July 31, 1990, by $20,000,000 each six months from that date through January 31, 1993, by $35,000,000 on July 31, 1993 and with the remaining $50,000,000 commitment expiring on January 31, 1994. Maximum borrowings outstanding within the commitment limits may not exceed specified percentages of inventories, land and buildings, and fixtures and equipment, all as defined in the Agreement. Under certain conditions, the commitments may be extended and/or increased. An annual commitment fee of 1/4% to 3/8% is required to be paid on the unused portion of the revolving line of credit. Interest rates specified may be increased by a maximum of 3/8 of 1% based on specified ratios of interest rate coverage and debt to equity. Under the revolving credit agreement, the Company is required, among other things, to maintain during fiscal year 1985 a minimum tangible net worth (defined to include the convertible subordinated debentures) of $150,000,000 (increasing annually to $213,165,000 by January 3, 1989), a debt to tangible net worth ratio of no more than 2 to 1, a current ratio of not less than 1.5 to 1, and a ratio of earnings before interest expense and income taxes to interest expense, net, of not less than 2 to 1. The Company was in compliance with all restrictive covenants as of February 2, 1986. The restrictive covenants related to the letter of credit agreements securing the industrial revenue bonds and the convertible subordinated debentures are no more restrictive than those under the revolving line of credit agreement. Interest expense in the accompanying consolidated statements of earnings is net of interest capitalized of $3,429,000 in fiscal 1985 and $1,462,000 in fiscal 1984. Leases The Company leases certain retail locations, office, and warehouse and distribution space, equipment, and vehicles under operating leases. All leases will expire within the next 25 years; however, it can be expected that in the normal course of business, leases will be renewed or replaced. Total rent expense, net of minor sublease income for the fiscal years ended February 2, 1986, February 3, 1985 and January 29, 1984 amounted to approximately $12,737,000, $6,718,000 and $4,233,000, respectively. Under the building leases, real estate taxes, insurance, maintenance, and operating expenses applicable to the leased property are obligations of the Company. Certain of the store leases provide for contingent rentals based on percentages of sales in excess of specified minimums. Contingent rentals for fiscal years ended February 2, 1986, February 3, 1985 and January 29, 1984 were approximately $650,000, $545,000 and $111,000. The approximate future minimum lease payments under operating leases at February 2, 1986 are as follows: Fiscal Year 1986 1987 1988 1989 1990 Thereafter $ 16,093,000 16,668,000 16,345,000 16,086,000 16,129,000 171,455,000 $252.776.000 Home Depot Spreadsheet 40% 1985 1986 1987 1989 5 7 13 Cash Flow from Operations Net Income Depreciation (Increase) in Receivables (Increase) in Inventories Increase in A/P 22 () () 5 (15) (68) 23 8 (11) (61) 30 | 1988 10 16 (21) (120) 11 (15) (86) 42 1990 19 31 (41) (235) 115 (30) (168) 58 2 Net Cash from Operations (47) (29) (41) (57) (81) (111) Average Collection Period # Days' Sales in Inventory Fixed Asset Turnover Gross Profit Percentage Other Op Exp / Sales Average Payable Period 14.08 107.6 3.518 25.86% 22.14% 148.34 9.06 66.2 3.989 30.00% 19.86% 50.37 - Debt Covenants Current Ratio Debt Ratio 2.0 80% | | Expected Sales Growth 40% Balance Sheet Actual 1985 10 1986 1989 139 14 28 27 Forecasted 1987 | 198 20 53 300 420 373 1522 74 Cash Receivables Inventory Total Current Assets 104 | 1990 155 145 823 1,023 138 214 266 153 190 588 731 1546 Gross PPE Accum Depr TOTAL ASSETS 199 (9) 380 279 (17) 528 390 (28) 735 (44) 1024 1764 (66) 1429 1,070 (97) 1996 104 Accounts Payable Short-term Loans Payable Total Current Liabilities 174 | 10 184 29 | 146 41 187 204 57 261 1286 80 366 401 111 1512 133 558 Long-term Debt TOTAL LIABILITIES 207 291 289 422 401 588 777 1,143 1.085 1,597 8819 196 Paid in Capital Retained Earnings TOTAL LIAB. & EQUITIES 50 139 380 162 44 528 144 212 51 74 735 | 1024 | 1429 61 306 93 1996 | 62 96 | 144 212 306 Paid in Capital Retained Earnings TOTAL LIAB. & EQUITIES | 50 39 | 380 44 51 61 93 528 Z35 74 1429 1024 1996 Statement of Retained Earnings 31 511 74 44 7 10 Beg. Retained Earnings + Net Income - Dividends End. Retained Earnings + - 39 5 0| 44| 611 13 19 0 7493 0 - 9 0| 51| 0 61 | 39 Sales Cost of Goods Sold Gross Profit Income Statement 1700 | | (519) 181 980 1,372 1,921| 2,689 (727) (1,017) (1,424) (1994) 253355| 497695 || 3,765 (2.791) 974 Depreciation Expense Other Operating Expenses Operating Profit (5) (155) (8) (217) 28 (11) (304) (16) (425) 56 (22) (595) 78 (31) (834) 109 21 40 (30) (9) (21) 1271 (80) 29 Interest Expense Income before Taxes Income Tax Expense Net Income g2qa (41) 15 (5) 10 (58) 20 (7) 13 857 1986 1987 1988 1989 1990 5 7 Statement of Cash Flows 40% 1985 Cash Flow from Operations Net Income Depreciation (Increase) in Receivables () (15) (Increase) in Inventories () (68) Increase in AP 23 Net Cash from Operations (47) | 19 31/ 5 8 (11) 11 (15) (86) 10 16 (21) (120) 13 22 (30) (168) (41) (61) 42 58 82 30 (29) (235) | 115 (111) (41) (57) (81) Cash from Investing Activities | Cash Paid for PPE Purchases , (92) (80) (111) (156) (218) (306) 19 Cash from Financing Activities | New Short-term Borrowing | New Long-term Borrowing New Investment Cash dividends paid Net Cash from Financing 12 112 34 16 157 48 82 12 0 | 113 23 219 68 | 0 310 31 308 94 0 433 0 158 221 Net Increase (Decrease) in Cash () (46) 4 6 8 11 6 Return on Equity (NI/Equity) 9.0% 4.7% 4.8% 4.9% 4.5% 4.8% Financing Needed 0 0 0 0 0 0 Short-term Loans Payable Long-term Debt Paid in Capital 6.0% 8.0% 207 50 1029415780 401 777 96 144 212 289 62 111 1,085 306 Dividends 0 000 0 0 Current Ratio (CA/CL) Debt Ratio (TL/TA) Return on Assets (EBIT/Assets) Return on Equity (NI/Equity) 2.262 .00 76.6% 79.9% 5.5% 5.3% 9.0% 4.7% 4.7% 1.99 80.0% 5.4% 4.8% 2.00 80.0% 5.5% 4.9% 2.00 80.0% 5.5% 4.5% 2.00 80.0% 5.5% 4.8% Sales 700 980 1,372 1,921 2,689 3,765