Answered step by step
Verified Expert Solution
Question
1 Approved Answer
1. Your customer is asking you to improve the response and performance of his first product prototype by minimizing the error and improving the


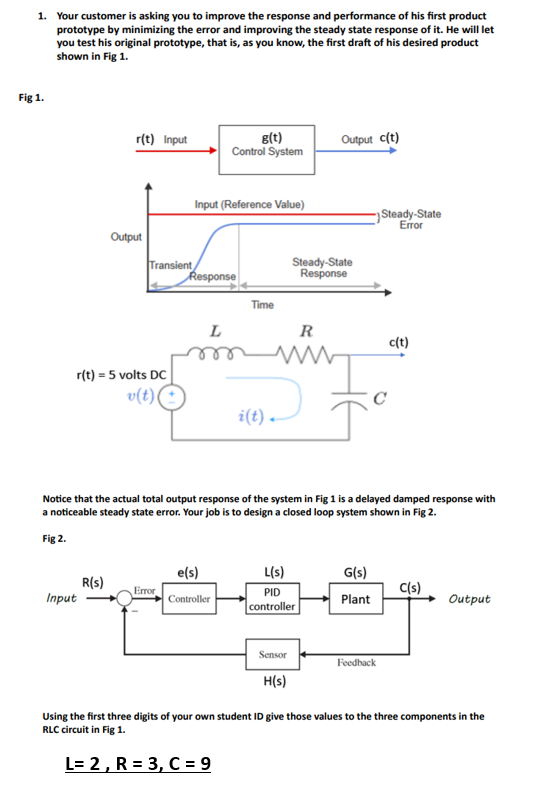
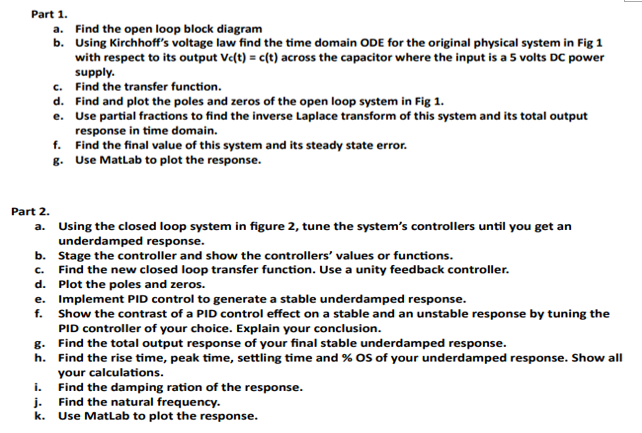
1. Your customer is asking you to improve the response and performance of his first product prototype by minimizing the error and improving the steady state response of it. He will let you test his original prototype, that is, as you know, the first draft of his desired product shown in Fig 1. Fig 1. r(t) Input Output Input r(t)= 5 volts DC v(t) ( Transient Input (Reference Value) R(s) Error Response g(t) Control System L e(s) Time Controller i(t). Output c(t) Steady-State Response R www Notice that the actual total output response of the system in Fig 1 is a delayed damped response with a noticeable steady state error. Your job is to design a closed loop system shown in Fig 2. Fig 2. G(s) L(s) PID controller eset Sensor H(s) Steady-State Error Plant c(t) Feedback C(s) Output Using the first three digits of your own student ID give those values to the three components in the RLC circuit in Fig 1. L= 2, R = 3, C = 9 Find the open loop block diagram Part 1. a. b. Using Kirchhoff's voltage law find the time domain ODE for the original physical system in Fig 1 with respect to its output Vc(t) = c(t) across the capacitor where the input is a 5 volts DC power supply. Part 2. a. c. Find the transfer function. d. Find and plot the poles and zeros of the open loop system in Fig 1. e. Use partial fractions to find the inverse Laplace transform of this system and its total output response in time domain. Find the final value of this system and its steady state error. Use Matlab to plot the response. g. h. f. g. Using the closed loop system in figure 2, tune the system's controllers until you get an underdamped response. Stage the controller and show the controllers' values or functions. b. C. Find the new closed loop transfer function. Use a unity feedback controller. d. Plot the poles and zeros. e. Implement PID control to generate a stable underdamped response. f. Show the contrast of a PID control effect on a stable and an unstable response by tuning the PID controller of your choice. Explain your conclusion. Find the total output response of your final stable underdamped response. Find the rise time, peak time, settling time and % OS of your underdamped response. Show all your calculations. Find the damping ration of the response. i. j. Find the natural frequency. k. Use MatLab to plot the response.
Step by Step Solution
There are 3 Steps involved in it
Step: 1
The skin friction coefficient Cf for a laminar boundary ...
Get Instant Access to Expert-Tailored Solutions
See step-by-step solutions with expert insights and AI powered tools for academic success
Step: 2

Step: 3

Ace Your Homework with AI
Get the answers you need in no time with our AI-driven, step-by-step assistance
Get Started


