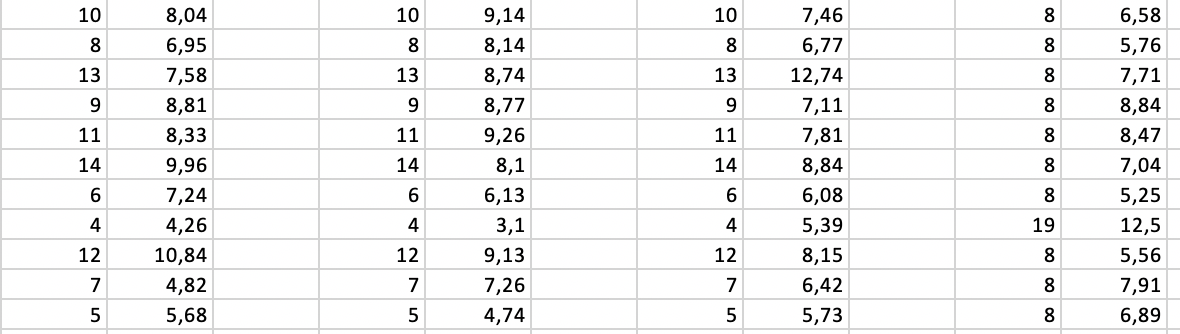
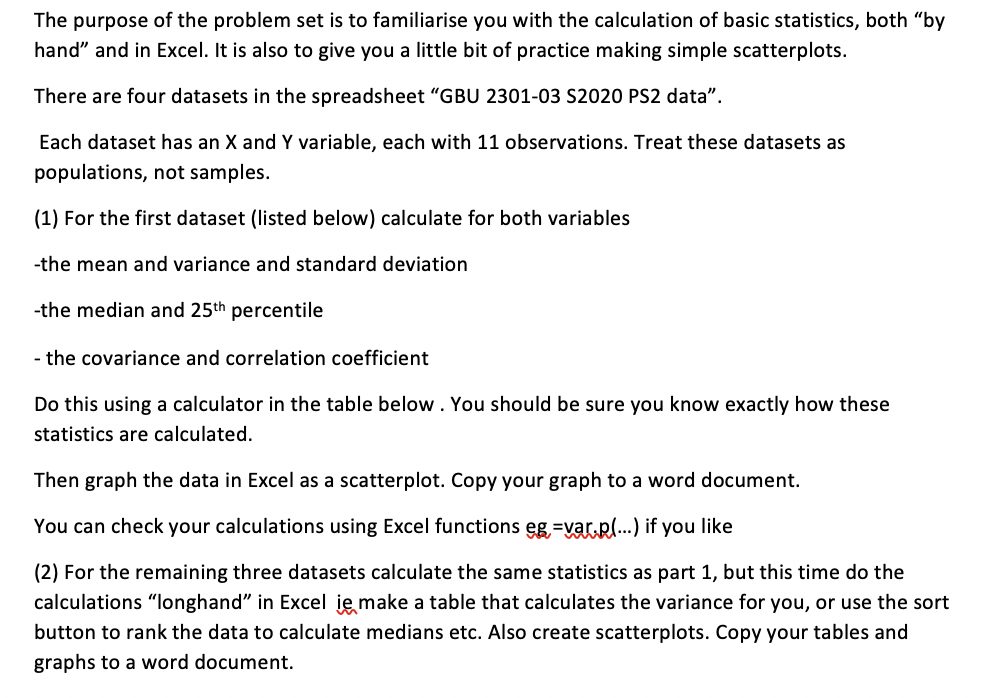
10. 10 10. 8. 8 8 8 8 13 13 13 8 9 9 9 8 11 11 11 8 14 8,04 6,95 7,58 8,81 8,33 9,96 7,24 4,26 10,84 4,82 5,68 14 9,14 8,14 8,74 8,77 9,26 8,1 6,13 3,1 9,13 7,26 4,74 14 7,46 6,77 12,74 7,11 7,81 8,84 6,08 5,39 8,15 6,42 5,73 8 6,58 5,76 7,71 8,84 8,47 7,04 5,25 12,5 5,56 7,91 6,89 6. 6 6 8 4 4 19 4 12. 12. 12. 8 7 7 7 8. 5 5 5 8 The purpose of the problem set is to familiarise you with the calculation of basic statistics, both by hand" and in Excel. It is also to give you a little bit of practice making simple scatterplots. There are four datasets in the spreadsheet GBU 2301-03 S2020 PS2 data. Each dataset has an X and Y variable, each with 11 observations. Treat these datasets as populations, not samples. (1) For the first dataset (listed below) calculate for both variables -the mean and variance and standard deviation -the median and 25th percentile - the covariance and correlation coefficient Do this using a calculator in the table below. You should be sure you know exactly how these statistics are calculated. Then graph the data in Excel as a scatterplot. Copy your graph to a word document. You can check your calculations using Excel functions eg =var.pl...) if you like (2) For the remaining three datasets calculate the same statistics as part 1, but this time do the calculations "longhand" in Excel ie make a table that calculates the variance for you, or use the sort button to rank the data to calculate medians etc. Also create scatterplots. Copy your tables and graphs to a word document. 10. 10 10. 8. 8 8 8 8 13 13 13 8 9 9 9 8 11 11 11 8 14 8,04 6,95 7,58 8,81 8,33 9,96 7,24 4,26 10,84 4,82 5,68 14 9,14 8,14 8,74 8,77 9,26 8,1 6,13 3,1 9,13 7,26 4,74 14 7,46 6,77 12,74 7,11 7,81 8,84 6,08 5,39 8,15 6,42 5,73 8 6,58 5,76 7,71 8,84 8,47 7,04 5,25 12,5 5,56 7,91 6,89 6. 6 6 8 4 4 19 4 12. 12. 12. 8 7 7 7 8. 5 5 5 8 The purpose of the problem set is to familiarise you with the calculation of basic statistics, both by hand" and in Excel. It is also to give you a little bit of practice making simple scatterplots. There are four datasets in the spreadsheet GBU 2301-03 S2020 PS2 data. Each dataset has an X and Y variable, each with 11 observations. Treat these datasets as populations, not samples. (1) For the first dataset (listed below) calculate for both variables -the mean and variance and standard deviation -the median and 25th percentile - the covariance and correlation coefficient Do this using a calculator in the table below. You should be sure you know exactly how these statistics are calculated. Then graph the data in Excel as a scatterplot. Copy your graph to a word document. You can check your calculations using Excel functions eg =var.pl...) if you like (2) For the remaining three datasets calculate the same statistics as part 1, but this time do the calculations "longhand" in Excel ie make a table that calculates the variance for you, or use the sort button to rank the data to calculate medians etc. Also create scatterplots. Copy your tables and graphs to a word document