Answered step by step
Verified Expert Solution
Question
1 Approved Answer
10. (3 pts) Performance - Using 5 year historical monthly data for 3 month T-Bill rate, SP 500 index, and Apple's price in Excel spreadsheet,
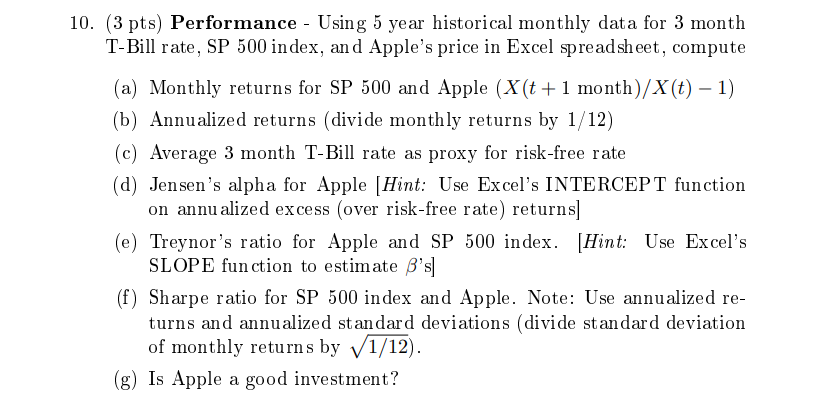
10. (3 pts) Performance - Using 5 year historical monthly data for 3 month T-Bill rate, SP 500 index, and Apple's price in Excel spreadsheet, compute (a) Monthly returns for SP 500 and Apple (X(t +1 month)/X(t) 1) (b) Annualized returns (divide monthly returns by 1/12) (c) Average 3 month T-Bill rate as proxy for risk-free rate (d) Jensen's alpha for Apple (Hint: Use Excel's INTERCEPT function on annu alized excess (over risk-free rate) returns] (e) Treynor's ratio for Apple and SP 500 index. (Hint: Use Excel's SLOPE function to estimate Bs] (f) Sharpe ratio for SP 500 index and Apple. Note: Use annualized re- turns and annualized standard deviations (divide standard deviation of monthly returns by 1/12). (g) Is Apple a good investment? 10. (3 pts) Performance - Using 5 year historical monthly data for 3 month T-Bill rate, SP 500 index, and Apple's price in Excel spreadsheet, compute (a) Monthly returns for SP 500 and Apple (X(t +1 month)/X(t) 1) (b) Annualized returns (divide monthly returns by 1/12) (c) Average 3 month T-Bill rate as proxy for risk-free rate (d) Jensen's alpha for Apple (Hint: Use Excel's INTERCEPT function on annu alized excess (over risk-free rate) returns] (e) Treynor's ratio for Apple and SP 500 index. (Hint: Use Excel's SLOPE function to estimate Bs] (f) Sharpe ratio for SP 500 index and Apple. Note: Use annualized re- turns and annualized standard deviations (divide standard deviation of monthly returns by 1/12). (g) Is Apple a good investment
Step by Step Solution
There are 3 Steps involved in it
Step: 1
Get Instant Access to Expert-Tailored Solutions
See step-by-step solutions with expert insights and AI powered tools for academic success
Step: 2
Step: 3
Ace Your Homework with AI
Get the answers you need in no time with our AI-driven, step-by-step assistance
Get Started