

Question
10) A credit score is used by credit agencies (such as mortgage companies and banks) to assess the creditworthiness of individuals. Values range from 300
10) A credit score is used by credit agencies (such as mortgage companies and banks) to assess the creditworthiness of individuals. Values range from 300 to 850, with a credit score over 700 considered to be a quality credit risk. According to a survey, the mean credit score is
707.3.
A credit analyst wondered whether high-income individuals (incomes in excess of $100,000 per year) had higher credit scores. He obtained a random sample of
45
high-income individuals and found the sample mean credit score to be
720.9
with a standard deviation of
80.9.
Conduct the appropriate test to determine if high-income individuals have higher credit scores at the
=0.05
level of significance.
Question content area bottom
Part 1
State the null and alternative hypotheses.
H0:
greater than>
not equals
less than
equals=
enter your response here
H1:
equals=
less than
greater than>
not equals
enter your response here
(Type integers or decimals. Do not round.)
Part 2
Identify the t-statistic.
t0=enter your response here
(Round to two decimal places as needed.)
Part 3
Identify the P-value.
P-value=enter your response here
(Round to three decimal places as needed.)
Part 4
Make a conclusion regarding the hypothesis.
Fail to reject
Reject
the null hypothesis. There
is not
is
sufficient evidence to claim that the mean credit score of high-income individuals is
equal to
less than
greater than
enter your response here.
11)
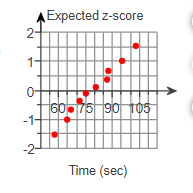
The mean waiting time at the drive-through of a fast-food restaurant from the time an order is placed to the time the order is received is 86.6 seconds. A manager devises a new drive-through system that he believes will decrease wait time. As a test, he initiates the new system at his restaurant and measures the wait time for 10 randomly selected orders. The wait times are provided in the table to the right. Complete parts (a) and (b) below. | 103.2 | 80.7 | |
66.7 | 95.2 | ||
57.4 | 87.5 | ||
75.3 | 71.8 | ||
64.9 | 87.3 |
Step by Step Solution
There are 3 Steps involved in it
Step: 1

Get Instant Access to Expert-Tailored Solutions
See step-by-step solutions with expert insights and AI powered tools for academic success
Step: 2

Step: 3
Ace Your Homework with AI
Get the answers you need in no time with our AI-driven, step-by-step assistance
Get Started
Algebra And Trigonometry (Subscription)
Authors: Michael Sullivan
9th Edition
0321830741, 9780321830746