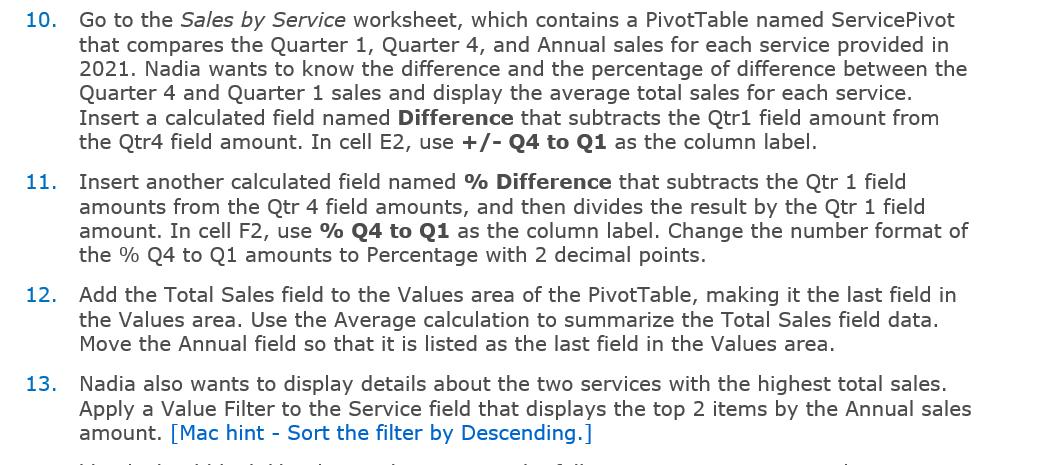
10. Go to the Sales by Service worksheet, which contains a PivotTable named ServicePivot that compares the Quarter 1, Quarter 4, and Annual sales


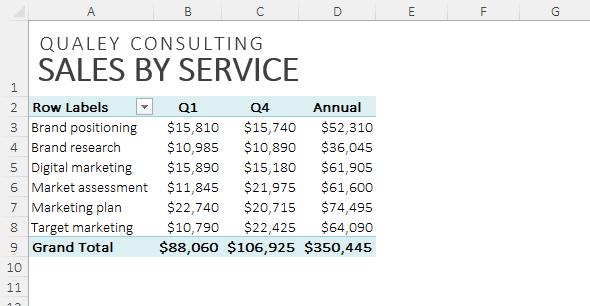
10. Go to the Sales by Service worksheet, which contains a PivotTable named ServicePivot that compares the Quarter 1, Quarter 4, and Annual sales for each service provided in 2021. Nadia wants to know the difference and the percentage of difference between the Quarter 4 and Quarter 1 sales and display the average total sales for each service. Insert a calculated field named Difference that subtracts the Qtr1 field amount from the Qtr4 field amount. In cell E2, use +/- Q4 to Q1 as the column label. 11. Insert another calculated field named % Difference that subtracts the Qtr 1 field amounts from the Qtr 4 field amounts, and then divides the result by the Qtr 1 field amount. In cell F2, use % Q4 to Q1 as the column label. Change the number format of the % Q4 to Q1 amounts to Percentage with 2 decimal points. 12. Add the Total Sales field to the Values area of the PivotTable, making it the last field in the Values area. Use the Average calculation to summarize the Total Sales field data. Move the Annual field so that it is listed as the last field in the Values area. 13. Nadia also wants to display details about the two services with the highest total sales. Apply a Value Filter to the Service field that displays the top 2 items by the Annual sales amount. [Mac hint - Sort the filter by Descending.] A B D E G QUALEY CONSULTING SALES BY SERVICE 2 Row Labels Q1 Q4 Annual 3 Brand positioning 4 Brand research 5 Digital marketing 6 Market assessment $11,845 7 Marketing plan 8 Target marketing 9 Grand Total $15,810 $15,740 $52,310 $10,985 $10,890 $36,045 $61,905 $61,600 $74,495 $15,890 $15,180 $21,975 $20,715 $2,740 $10,790 $88,060 $106,925 $350,445 $22,425 $64,090 10 11 LL.
Step by Step Solution
3.55 Rating (148 Votes )
There are 3 Steps involved in it
Step: 1
INSERT A CALCULATED FIELD IN A PIVOTTABLE A calculated field is one that appears in the PivotTable b...
See step-by-step solutions with expert insights and AI powered tools for academic success
Step: 2

Step: 3

Ace Your Homework with AI
Get the answers you need in no time with our AI-driven, step-by-step assistance
Get Started


