

Question
10. Look at the following sample of MATLAB code (which has line numbers added for ease of reference) and answer the following questions about it.
10. Look at the following sample of MATLAB code (which has line numbers added for ease of reference) and answer the following questions about it.
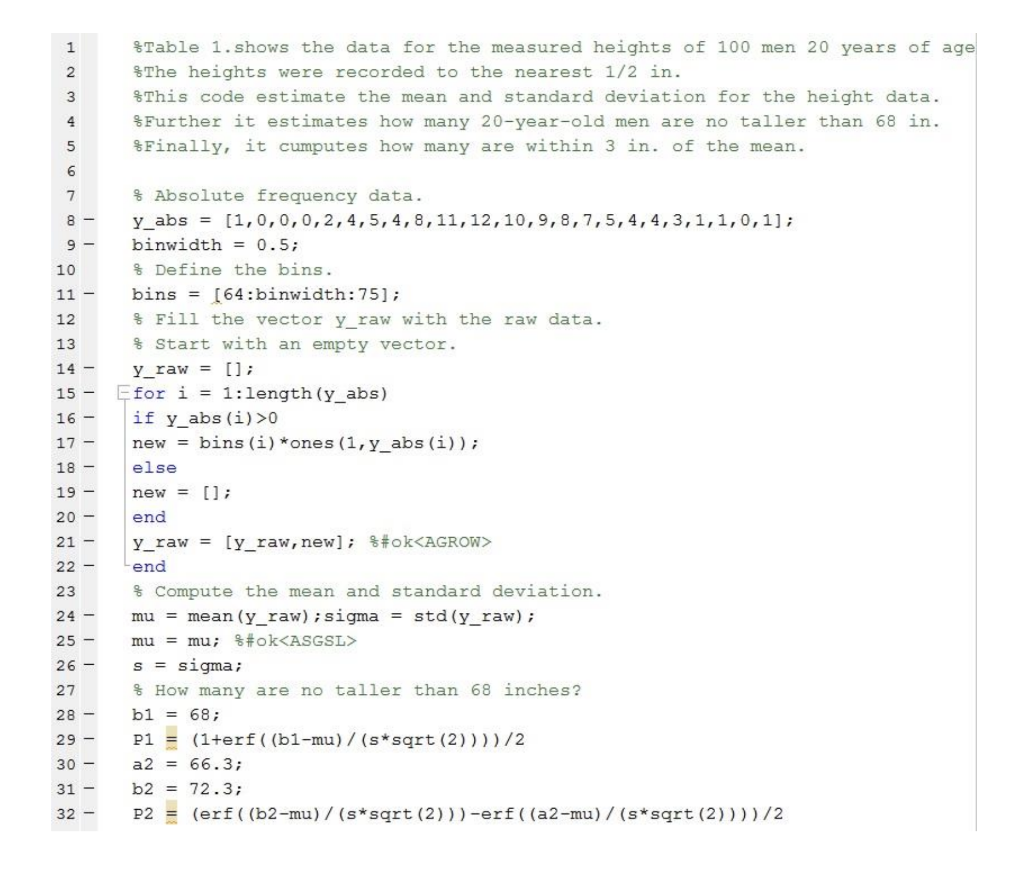
a) How many loops and conditional statements are there? Specify the number of lines where the loops and conditional statements start and finish.
b) What is the general purpose for the codes from line 13 to the line 21?
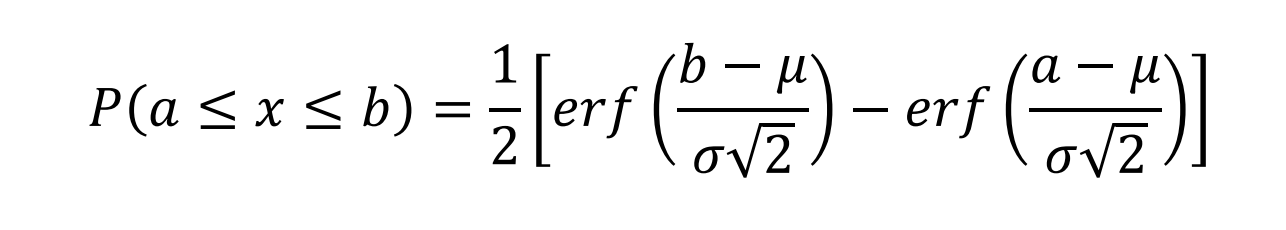
c) Explain the reason for choosing the values of the variables of line 30 and line 31. Suppose that the calculated mean is 69.3, and if the formula for calculating the probability of variable that is no less than and no greater than is written as ( ), and that it can be computed as follows:
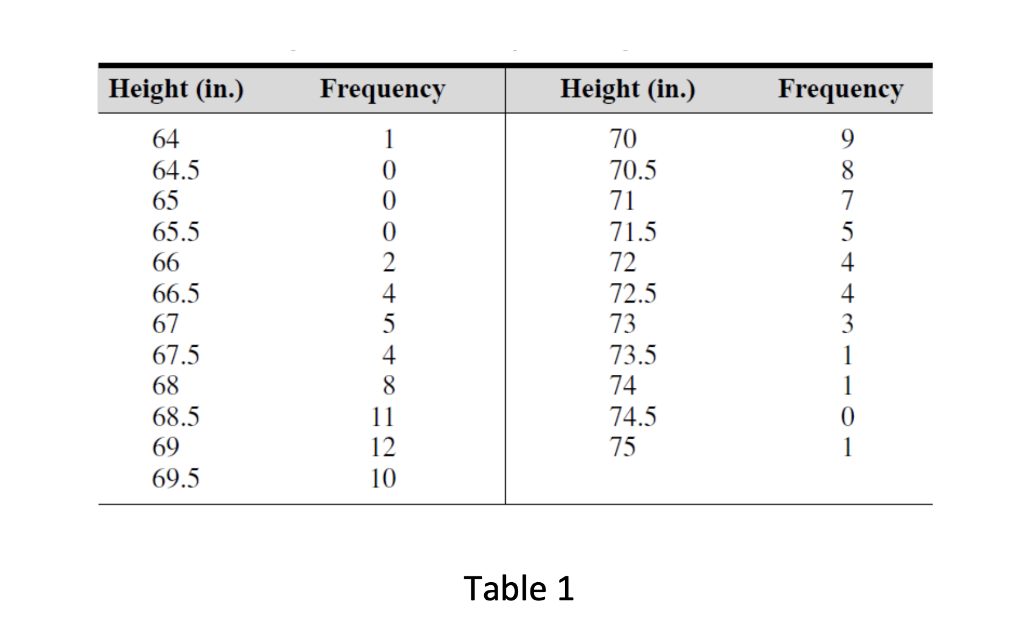
1 2 3 $Table 1. shows the data for the measured heights of 100 men 20 years of age The heights were recorded to the nearest 1/2 in. *This code estimate the mean and standard deviation for the height data. Further it estimates how many 20-year-old men are no taller than 68 in. $Finally, it cumputes how many are within 3 in. of the mean. 4 5 6 7 8 9 10 11 - 12 13 14 15 16 17 18 19 $ Absolute frequency data. y_abs = (1,0,0,0,2,4,5,4,8,11,12,10, 9, 8, 7,5,4,4,3,1,1,0,1); binwidth = 0.5; & Define the bins. bins = [64:binwidth:75); % Fill the vector y_raw with the raw data. $ Start with an empty vector. Y_raw = []; for i = 1:length (y_abs) if y_abs (i) >0 new = bins (i) *ones (1, y_abs (i)); else new = []; end Y_raw = [y_raw, new]; $#ok
Step by Step Solution
There are 3 Steps involved in it
Step: 1

Get Instant Access to Expert-Tailored Solutions
See step-by-step solutions with expert insights and AI powered tools for academic success
Step: 2

Step: 3
Ace Your Homework with AI
Get the answers you need in no time with our AI-driven, step-by-step assistance
Get Started
Learning MySQL Get A Handle On Your Data
Authors: Seyed M M Tahaghoghi
1st Edition
0596529465, 9780596529468