Answered step by step
Verified Expert Solution
Link Copied!

Question

1 Approved Answer

(10 points) The following chart depicts the results of an event study of stock abnormal returns in a window of -30 to +30 days around
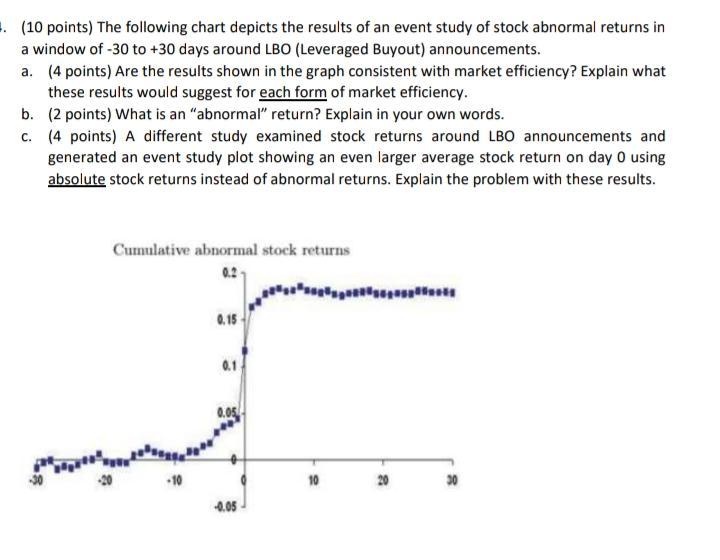
image text in transcribed

(10 points) The following chart depicts the results of an event study of stock abnormal returns in a window of -30 to +30 days around LBO (Leveraged Buyout) announcements. a. (4 points) Are the results shown in the graph consistent with market efficiency? Explain what these results would suggest for each form of market efficiency. b. (2 points) What is an "abnormal" return? Explain in your own words. C. (4 points) A different study examined stock returns around LBO announcements and generated an event study plot showing an even larger average stock return on day 0 using absolute stock returns instead of abnormal returns. Explain the problem with these results. Cumulative abnormal stock returns 0.2 *** 0.15 0.1 0.05 -10 10 20 30 -0.05

Step by Step Solution

There are 3 Steps involved in it

Step: 1

blur-text-image

Get Instant Access to Expert-Tailored Solutions

See step-by-step solutions with expert insights and AI powered tools for academic success

Step: 2

blur-text-image_2

Step: 3

blur-text-image_3

Ace Your Homework with AI

Get the answers you need in no time with our AI-driven, step-by-step assistance

Get Started

Recommended Textbook for

The Cyber Attack Survival Manual

Authors: Heather Vescent ,Nick Selby

1st Edition

1681886545, 978-1681886541

More Books

Students also viewed these Finance questions