

Answered step by step
Verified Expert Solution
Question
1 Approved Answer
10 Skipped Consider the following table for the period from 1973 through 1980. Year 1973 1974 1975 1976 1977 1978 1979 1980 T-bill return 6.93%
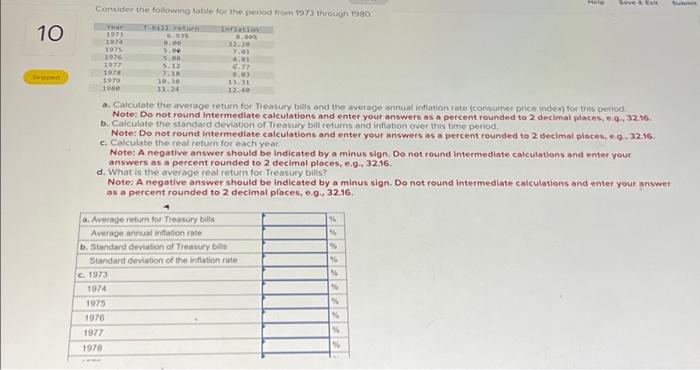
10 Skipped Consider the following table for the period from 1973 through 1980. Year 1973 1974 1975 1976 1977 1978 1979 1980 T-bill return 6.93% 8.00 5.80 5.08 5.12 7.18 10.38 11.24 c. 1973 1974 1975 1976 1977 1978 Inflation 8.80% 12.20 7.01 4.81 6.77 9.03 13.31 12.40 a. Calculate the average return for Treasury bills and the average annual inflation rate (consumer price index) for this period. Note: Do not round intermediate calculations and enter your answers as a percent rounded to 2 decimal places, e.g., 32.16. b. Calculate the standard deviation of Treasury bill returns and inflation over this time period. Note: Do not round intermediate calculations and enter your answers as a percent rounded to 2 decimal places, e.g., 32.16. c. Calculate the real return for each year. Note: A negative answer should be indicated by a minus sign. Do not round intermediate calculations and enter your answers as a percent rounded to 2 decimal places, e.g., 32.16. d. What is the average real return for Treasury bills? a. Average return for Treasury bills Average annual inflation rate b. Standard deviation of Treasury bills Standard deviation of the inflation rate Note: A negative answer should be indicated by a minus sign. Do not round intermediate calculations and enter your answer as a percent rounded to 2 decimal places, e.g., 32.16. % % Help % Save & Exit % % % % % % % Submit
Step by Step Solution
There are 3 Steps involved in it
Step: 1

Get Instant Access to Expert-Tailored Solutions
See step-by-step solutions with expert insights and AI powered tools for academic success
Step: 2

Step: 3
Ace Your Homework with AI
Get the answers you need in no time with our AI-driven, step-by-step assistance
Get Started
Handbook Of Corporate Finance Empirical Corporate Finance Volume 1
Authors: B. Espen Eckbo
1st Edition
044453265X, 0080559565, 9780444532657, 9780080559568