

Answered step by step
Verified Expert Solution
Question
1 Approved Answer
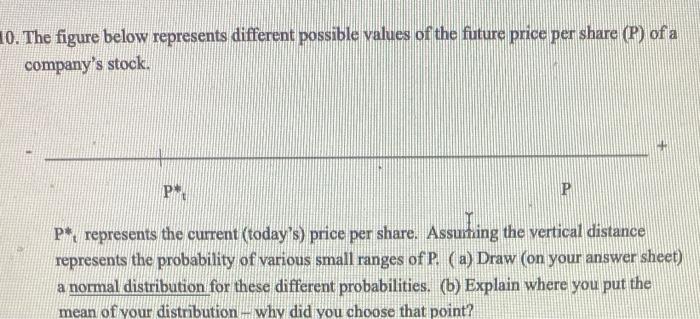
10. The figure below represents different possible values of the future price per share (P) of a company's stock. P P* p*, represents the current
Step by Step Solution
There are 3 Steps involved in it
Step: 1

Get Instant Access to Expert-Tailored Solutions
See step-by-step solutions with expert insights and AI powered tools for academic success
Step: 2

Step: 3
Ace Your Homework with AI
Get the answers you need in no time with our AI-driven, step-by-step assistance
Get Started
Finance And Financial Intermediation
Authors: Harold L. Cole
1st Edition
0190941707, 978-0190941703