

Answered step by step
Verified Expert Solution
Question
1 Approved Answer
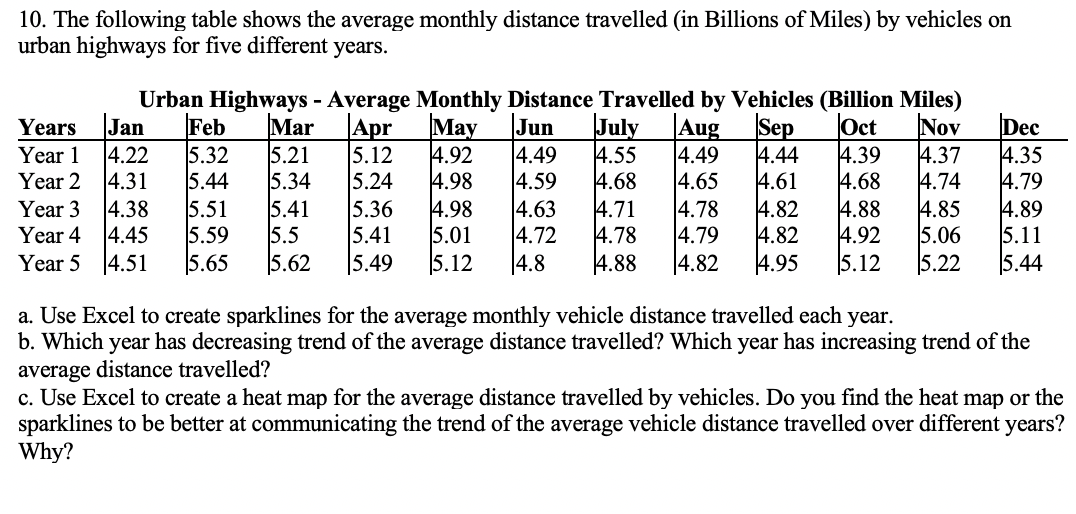
10. The following table shows the average monthly distance travelled (in Billions of Miles) by vehicles on urban highways for ve different years. Urban Highways
Step by Step Solution
There are 3 Steps involved in it
Step: 1

Get Instant Access to Expert-Tailored Solutions
See step-by-step solutions with expert insights and AI powered tools for academic success
Step: 2

Step: 3
Ace Your Homework with AI
Get the answers you need in no time with our AI-driven, step-by-step assistance
Get Started
Calculus Early Transcendentals
Authors: James Stewart
8th edition
1285741552, 9781305482463 , 978-1285741550