

Answered step by step
Verified Expert Solution
Question
1 Approved Answer
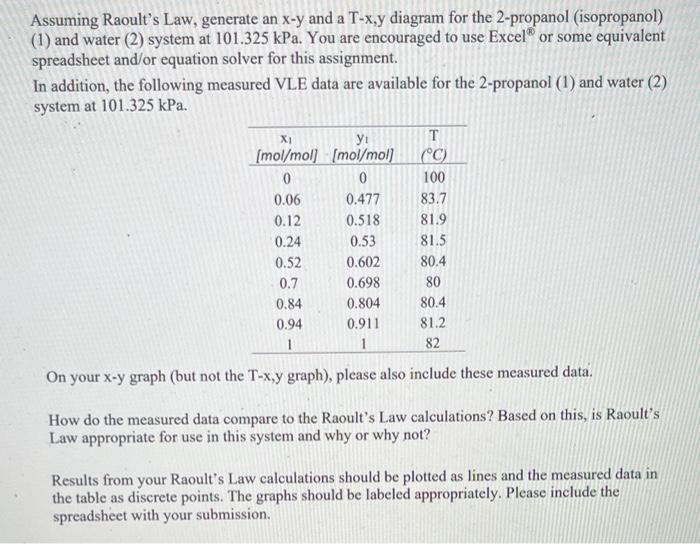
100 Assuming Raoult's Law, generate an x-y and a T-x,y diagram for the 2-propanol (isopropanol) (1) and water (2) system at 101.325 kPa. You are
Step by Step Solution
There are 3 Steps involved in it
Step: 1

Get Instant Access to Expert-Tailored Solutions
See step-by-step solutions with expert insights and AI powered tools for academic success
Step: 2

Step: 3
Ace Your Homework with AI
Get the answers you need in no time with our AI-driven, step-by-step assistance
Get Started
Finance Budget And Management For Reference Services Routledge Library Editions Library And Information Science
Authors: Ruth A. Fraley, Bill Katz
1st Edition
0367374293, 978-0367374297