

Answered step by step
Verified Expert Solution
Question
1 Approved Answer
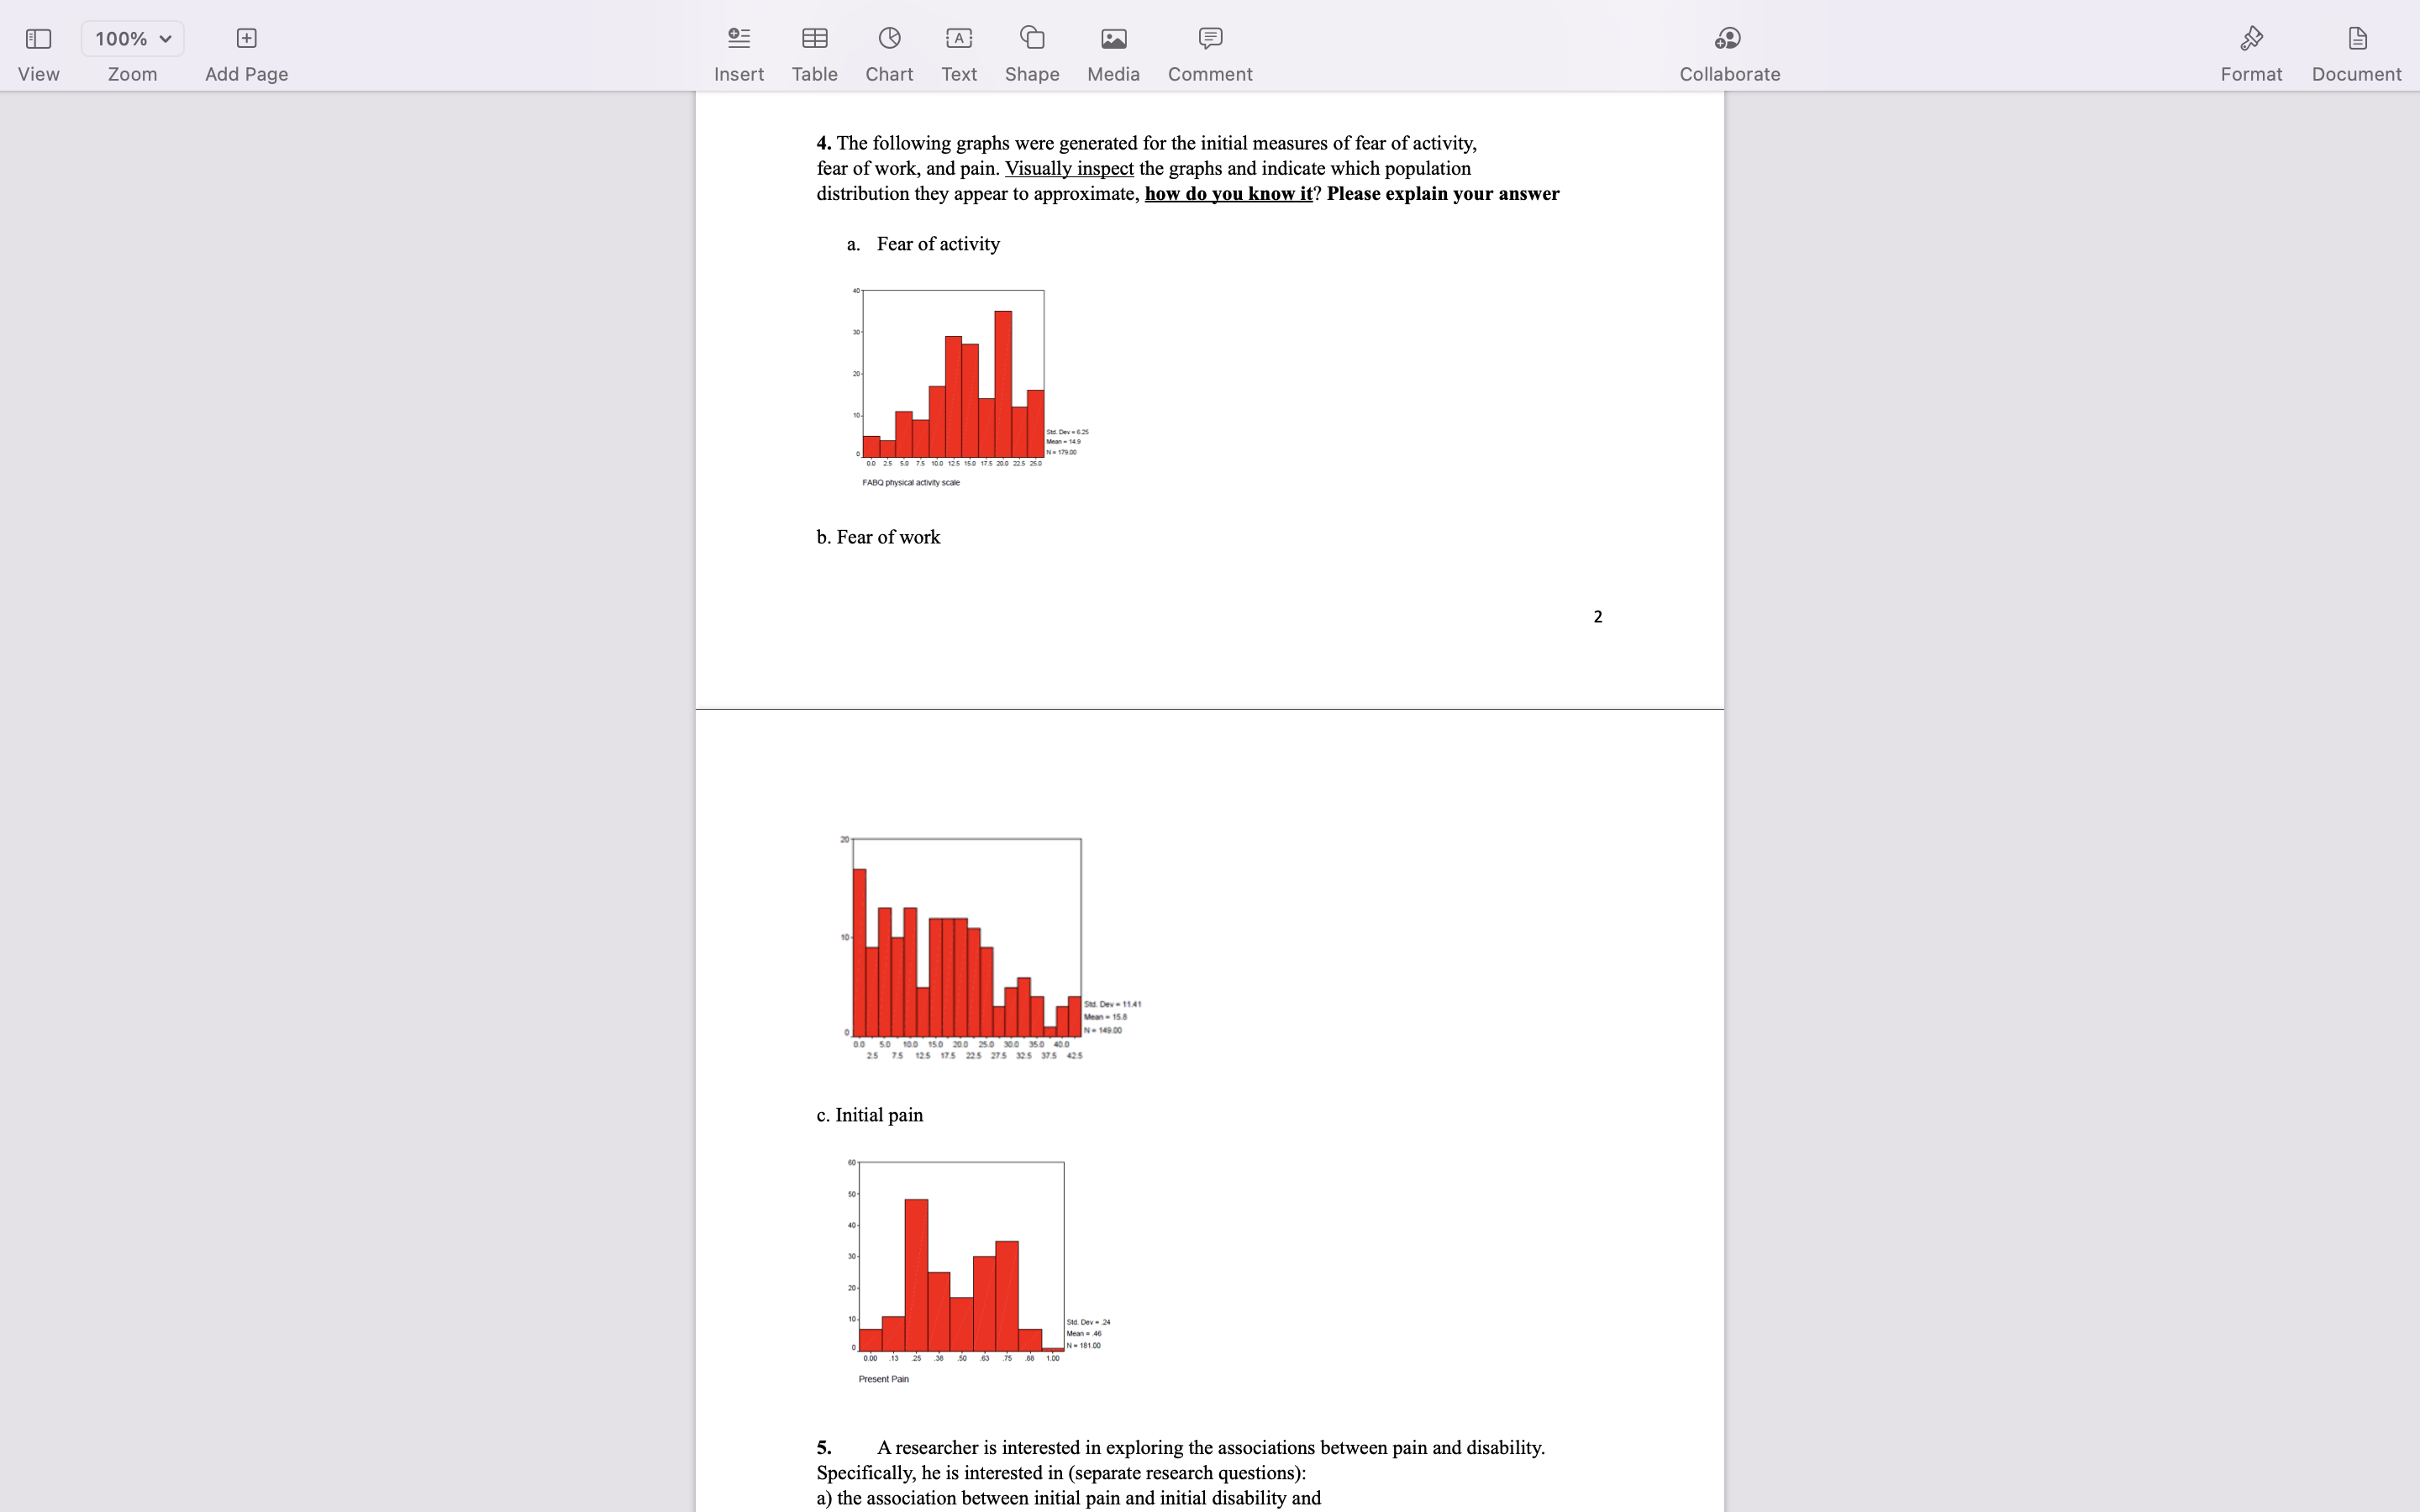
100% + EB A View Zoom Add Page Insert Table Chart Text t Shape Media Comment Collaborate Format Document 4. The following graphs were generated

Step by Step Solution
There are 3 Steps involved in it
Step: 1

Get Instant Access to Expert-Tailored Solutions
See step-by-step solutions with expert insights and AI powered tools for academic success
Step: 2

Step: 3
Ace Your Homework with AI
Get the answers you need in no time with our AI-driven, step-by-step assistance
Get Started
Physics For Scientists And Engineers
Authors: Raymond A Serway, John W Jewett
10th Edition
1337671711, 9781337671712