Answered step by step
Verified Expert Solution
Question
1 Approved Answer
10.1 1 Graphing calculator sales. The table below presents the quarterly sales index for one brand of graphing calculator at a campus bookstore. The quarters
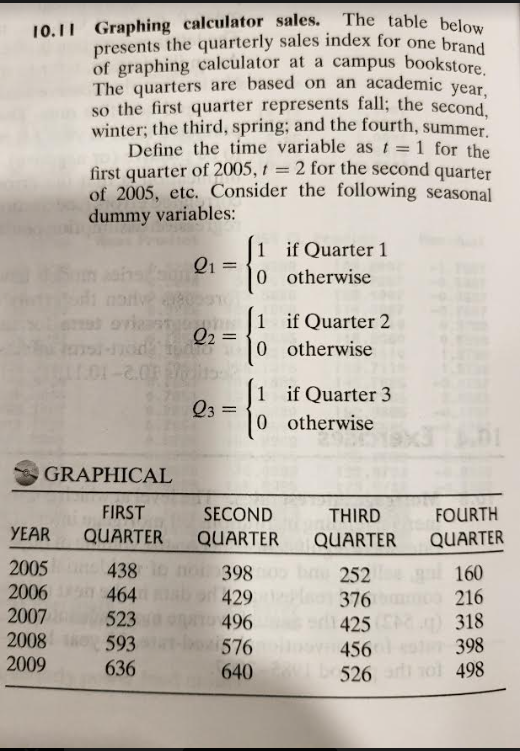
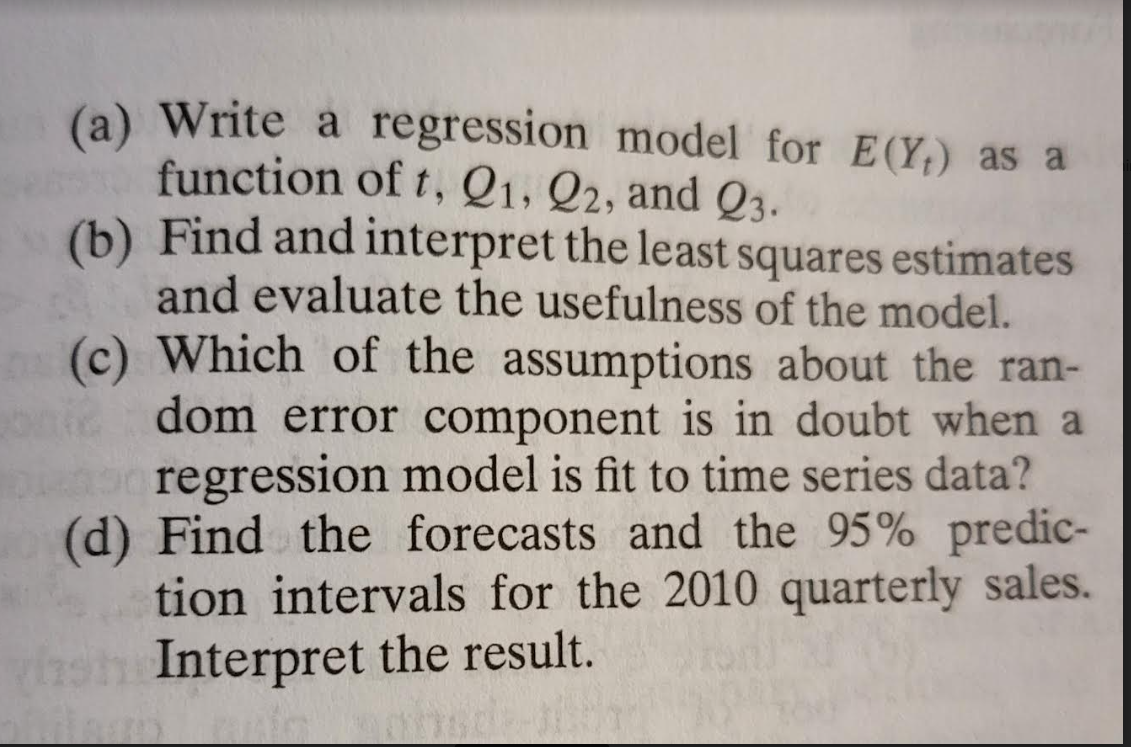
10.1 1 Graphing calculator sales. The table below presents the quarterly sales index for one brand of graphing calculator at a campus bookstore. The quarters are based on an academic year, so the first quarter represents fall; the second, winter; the third, spring; and the fourth, summer. Define the time variable as f = 1 for the first quarter of 2005, 1 = 2 for the second quarter of 2005, etc. Consider the following seasonal dummy variables: if Quarter 1 21 = 0 otherwise Self nonive deegan 1 if Quarter 2 @2 = 10 otherwise 1.01-2.08 9wits 1 if Quarter 3 Q3 = 0 otherwise GRAPHICAL FIRST SECOND THIRD FOURTH YEAR QUARTER QUARTER QUARTER QUARTER 2005 438 398 252 160 2006 464 429 376 216 2007 523 VO AND 496 (CPC ) 318 2008 593 Shto 576 456 398 2009 636 640 526 arlo1 498(a) Write a regression model for E(Y,) as a function of t, 21, 22, and Q3. (b ) Find and interpret the least squares estimates and evaluate the usefulness of the model. (c) Which of the assumptions about the ran- dom error component is in doubt when a regression model is fit to time series data? (d) Find the forecasts and the 95% predict tion intervals for the 2010 quarterly sales. Interpret the result
Step by Step Solution
There are 3 Steps involved in it
Step: 1
Get Instant Access to Expert-Tailored Solutions
See step-by-step solutions with expert insights and AI powered tools for academic success
Step: 2
Step: 3
Ace Your Homework with AI
Get the answers you need in no time with our AI-driven, step-by-step assistance
Get Started