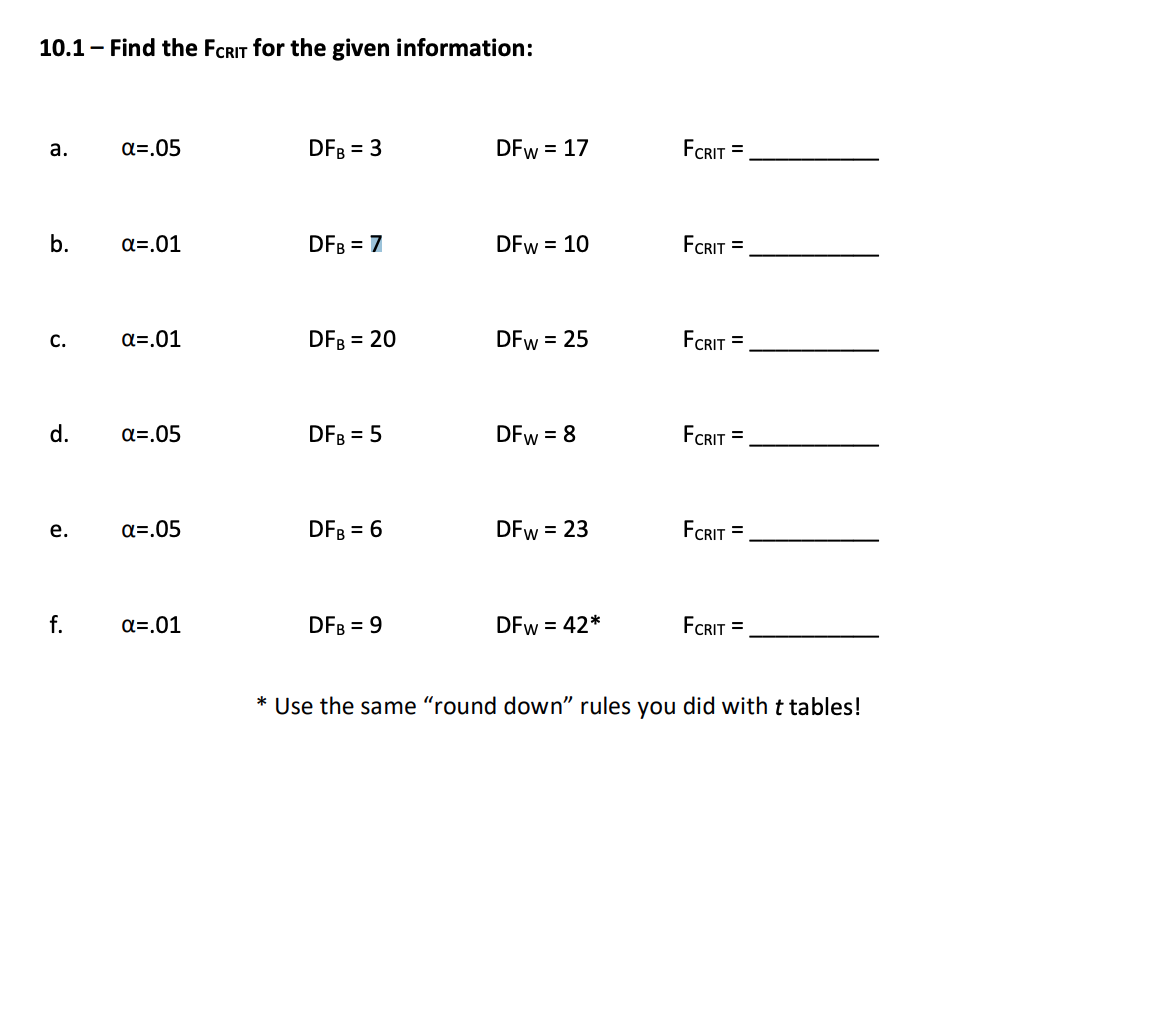
10.1 - Find the FCRIT for the given information: a. a=.05 DFB = 3 DFW = 17 FCRIT = b. a=.01 DFB = 7 DFw
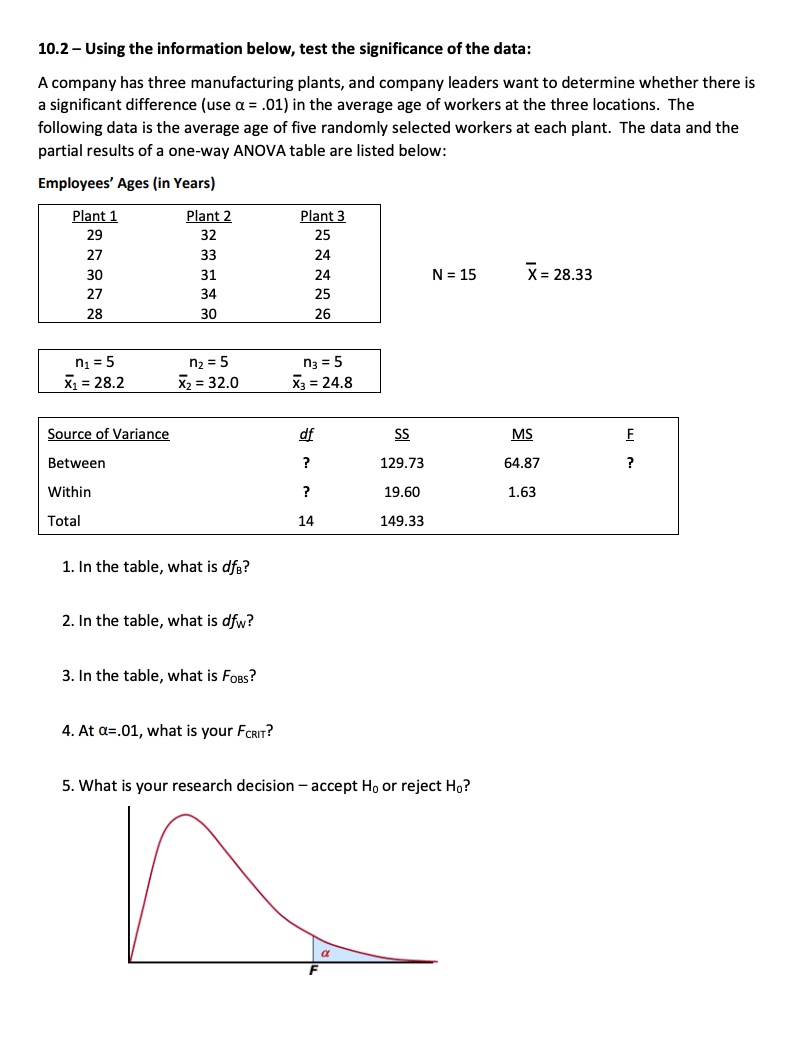
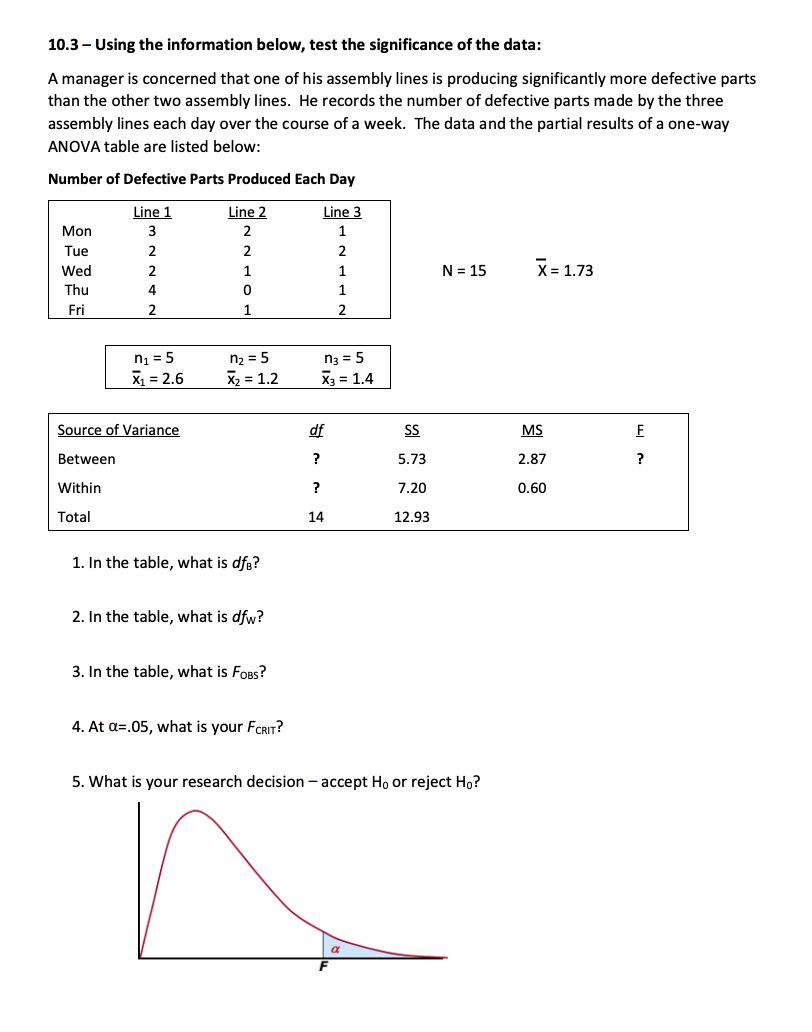
10.1 - Find the FCRIT for the given information: a. a=.05 DFB = 3 DFW = 17 FCRIT = b. a=.01 DFB = 7 DFw = 10 FCRIT = C. a=.01 DFB = 20 DFW = 25 FCRIT = d. a=.05 DFB = 5 DFW = 8 FCRIT = e. a=.05 DFB = 6 DFW = 23 FCRIT = f. a=.01 DFB = 9 DFw = 42* FCRIT = * Use the same "round down" rules you did with t tables!10.2 Using the information below, test the significance of the data: A companyr has three manufacturing plants, and company leaders want to determine whether there is a significant difference [use :1: .01) in the average age of workers at the three locations. The following data is the average age of ve randomly selected workers at each plant. The data and the partial results of a onewayr ANOVA table are listed below: Employees' Ages {in Years} Plant 1 Plant 2 Plant 3 29 32 25 2? 33 24 _ 30 31 24 N = 15 X: 28.33 2? 34 25 28 30 26 "1 = 5 n; = 5 "3 = 5 1 = 28.2 i; = 32.0 i; = 24.8 Source of Variance g; g E L Between ? 129.23 54.8? ? Within ? 19.50 1.63 Total 14 149.33 1. In the table, what is dfg? 2. In the table, what is dfw? 3. In the table, what is F035? 4. At 11:.01, what is your Fm\"? 5. What is your research decision accept H0 or reject Ho? 10.3 Using the information below, test the significance of the data: A manager is concerned that one of his assembly lines is producing significantly more defective parts than the other two assemblyr lines. He records the number of defective parts made bythe three assembly lines each claimr over the course ofa week. The data and the partial results of a onewayr ANOVA table are listed below: Number of Defective Parts Produced Each Day Mon 3 2 1 Tue 2 2 2 Wed 2 1 1 N 4 U 1 2 1 2 15 Ti: 1.?3 Thu Fri Source of Variance off g MS E Between ? 5.?3 2.8? ? Within ? 7.20 0.60 Total 14 12.93 1. In the table, what is dfa? 2. In the table, what is dfw? 3. In the table, what is F035? 4. At 11:.05, what is your FER\"? 5. What is your research decision - accept H0 or reject Ho? 10.4 Using the information below, test the significance of the data: A group of paramedics does not believe that the number of er'nergencilir calls is the same for each shift. To test their claim, they record the number of calls received during each shift for seven days. Based on this data, can the paramedics conclude that the average number of calls is different between shifts? The data and the partial results of a oneway ANOVAtable are listed below: Number of Emergency Calls Received per Shift Morning Afternoon Night Sun 2 3 5 Mon 3 4 4 _ Tue 2 4 5 N = 21 X = 3.52 Wed 4 5 3 Thu 3 3 2 Fri 1 2 5 Sat 3 5 6 "1 = 1' n: = 1' n; = 1' i1 = 2.6 '2 = 3.? i3 = 4.3 Source of Variance off S_S m E Between ? 10.5? 5.33 ? Within ? 24.5? 1.3? Total 20 35.24 1. In the table, what is dfa? 2. In the table, what is dfw? 3. In the table, what is F035? 4. At 11:.01, what is your Fm\"? 5. What is your research decision accept Hg or reject Ho? 10.5 Using the information below, test the significance of the data: A university is comparing the GPAs between the four sororities on campus. The GPAs for ten girls in each sorority are shown below. Based on this data, can you conclude thatthere is a signicant difference in the average GPA between the four sororities on campus? GPAs of Four Cam pus Sororities Tri-Delta Phi Mu Chi Omega Beta Phi 2.5 3.1 2.? 3.1 3.4 3.4 2.9 3.2 4.0 3.6 2.3 3.1 N = 40 i = 3.16 3.8 3.6 2.8 2.8 2.? 3.? 2.9 2.9 2.8 3.0 3.1 3.1 2.8 4.0 2.9 3.0 3.2 3.9 2.? 3.3 3.1 4.0 2.6 2.? 3.9 3.4 3.3 2.6 "1:10 \"2:10 "3:10 \"4:10 1=3.2 {2:16 {3:19 24:31) Source of Variance Elf S_S M_S E Between 1' 2.88 0.96 ? Within ? 4.53 0.13 Total 39 2.42 1. In the table, what is 03%? 2. In the table, what is dfw? 3. In the table, what is F035? 4. At 11:.05, what is your FCRIT? 5. What is your research decision accept H0 or reject Ho
Step by Step Solution
There are 3 Steps involved in it
Step: 1
Get Instant Access to Expert-Tailored Solutions
See step-by-step solutions with expert insights and AI powered tools for academic success
Step: 2
Step: 3
Ace Your Homework with AI
Get the answers you need in no time with our AI-driven, step-by-step assistance