

Question
10.11. Follow up onproblem 9.17, in which you compared Protestants and Catholics for significant differences in their level of education ( educ ) and self-rated
10.11.
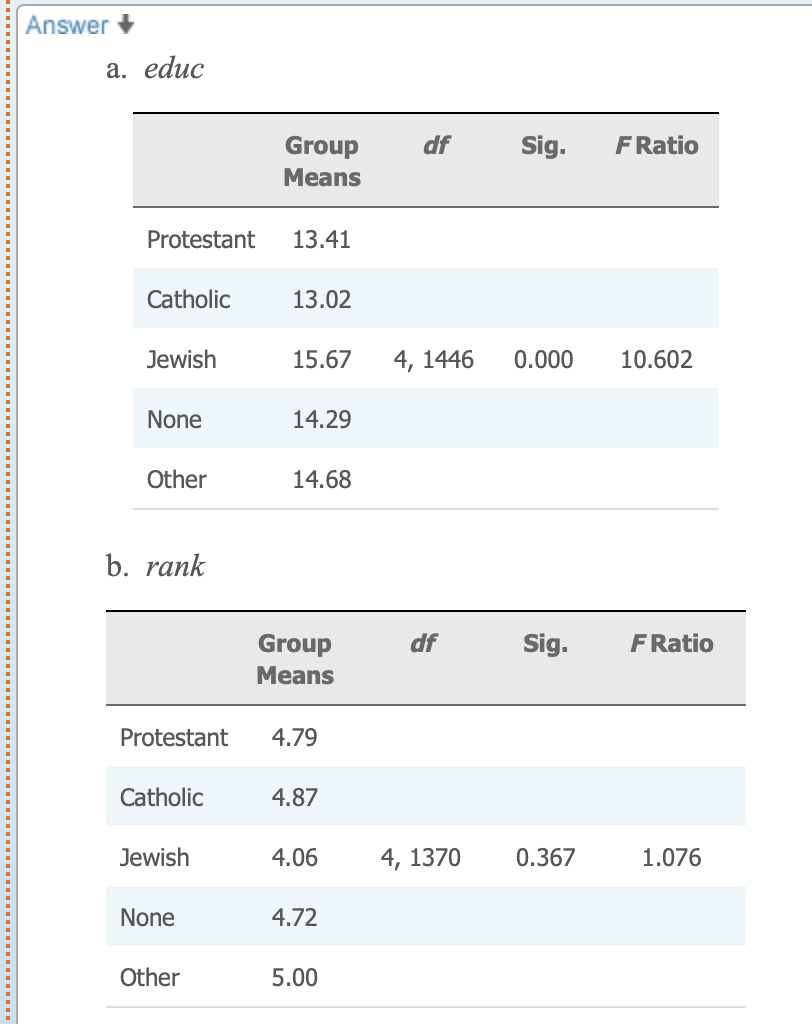
Follow up onproblem 9.17, in which you compared Protestants and Catholics for significant differences in their level of education (educ) and self-rated social position (rank). We will now useOne-Way Anovato compare all five categories of thereligvariable.
- Click the SPSS icon on your desktop.
- Load theGSS2012database.
- ClickAnalyze?Compare Means?One-Way Anova.
- Findeducandrankin the list of variables and move them into theDependent Listbox.
- Findreligin the list of variables and move it into theFactorbox.
- ClickOptionsand click the box next toDescriptivein theStatisticsbox to get statistical information on each category ofrelig. ClickContinue.
- ClickOKand the results of the test will be printed to the SPSS output window.
Find the group means, theFratio, degrees of freedom, and the "Sig." (which is the exact probability of getting this difference ifis true) and report the results of the test in a few sentences.
Please see screenshot for the data. Thank you
Step by Step Solution
There are 3 Steps involved in it
Step: 1

Get Instant Access to Expert-Tailored Solutions
See step-by-step solutions with expert insights and AI powered tools for academic success
Step: 2

Step: 3
Ace Your Homework with AI
Get the answers you need in no time with our AI-driven, step-by-step assistance
Get Started
Mathematical Interest Theory
Authors: Leslie Jane, James Daniel, Federer Vaaler
3rd Edition
147046568X, 978-1470465681