

Answered step by step
Verified Expert Solution
Question
1 Approved Answer
11 2 3 4 5 6 7 8 9 10 Days ations. Include a brief explanation. d with each rule violation. Include a brief -350
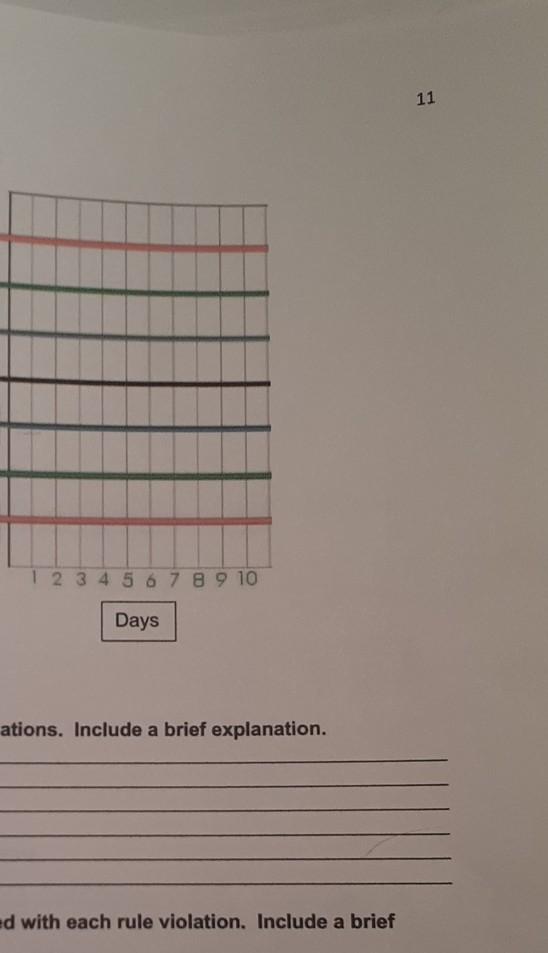
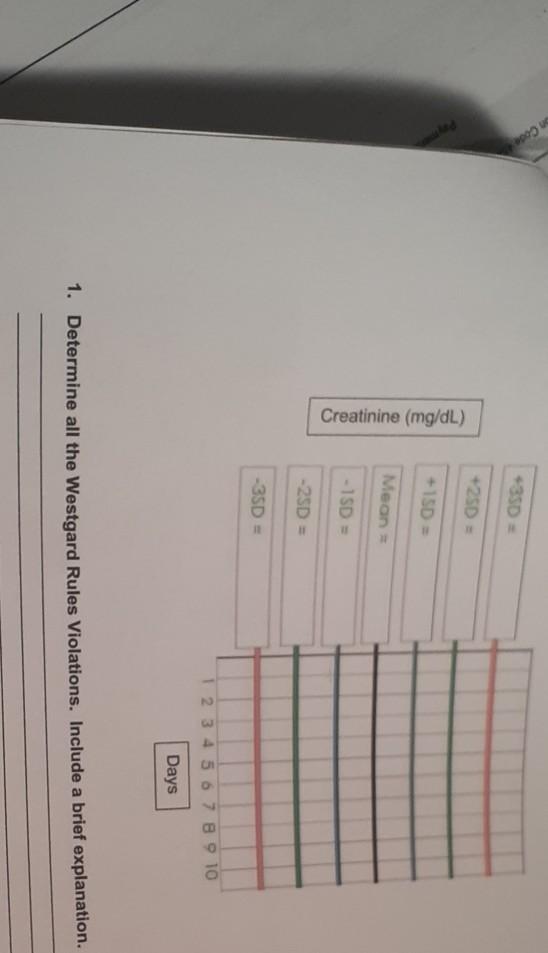
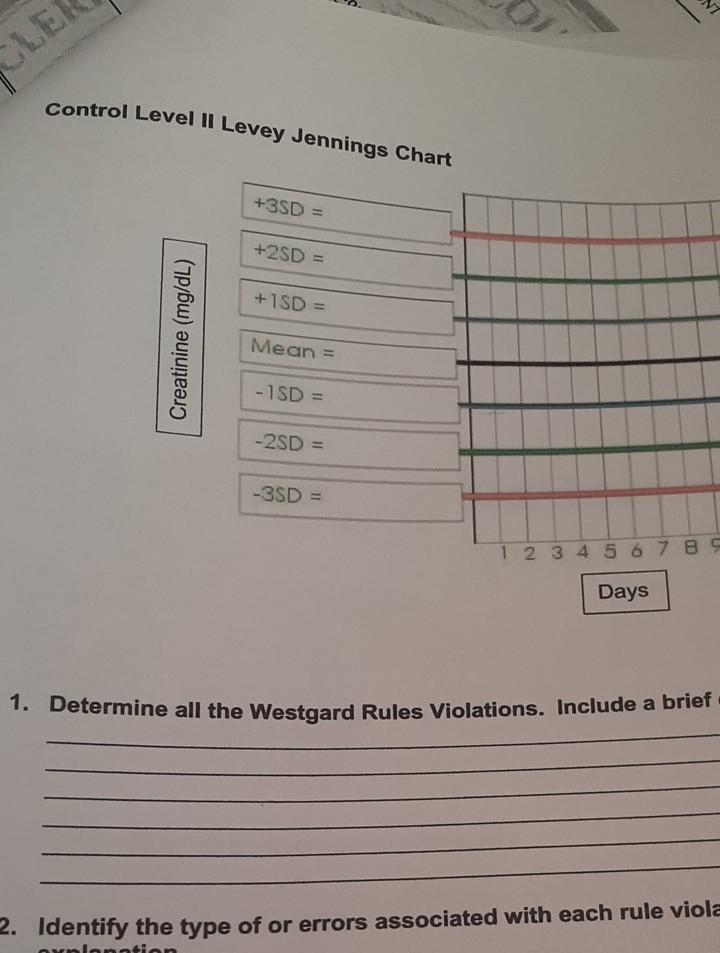
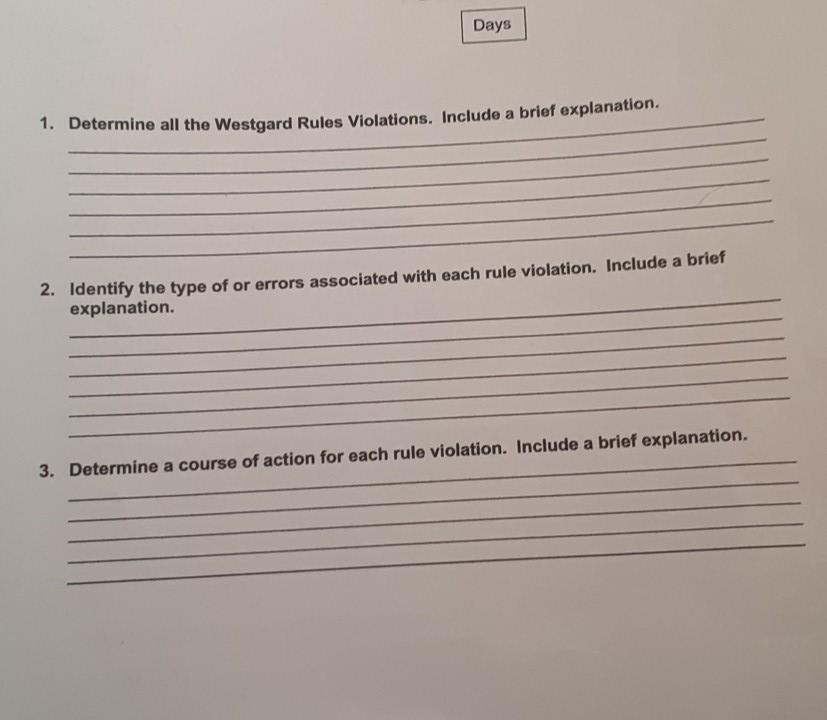
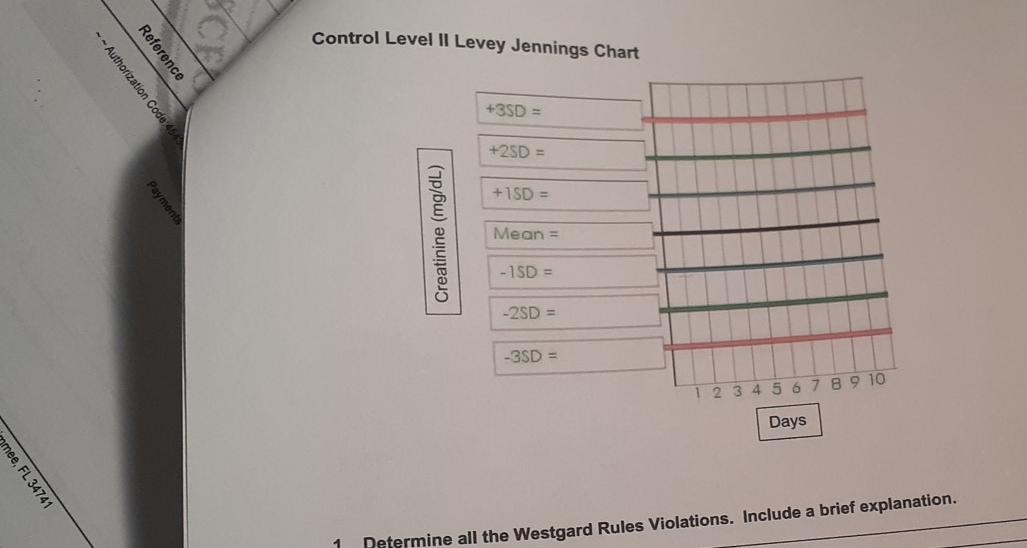
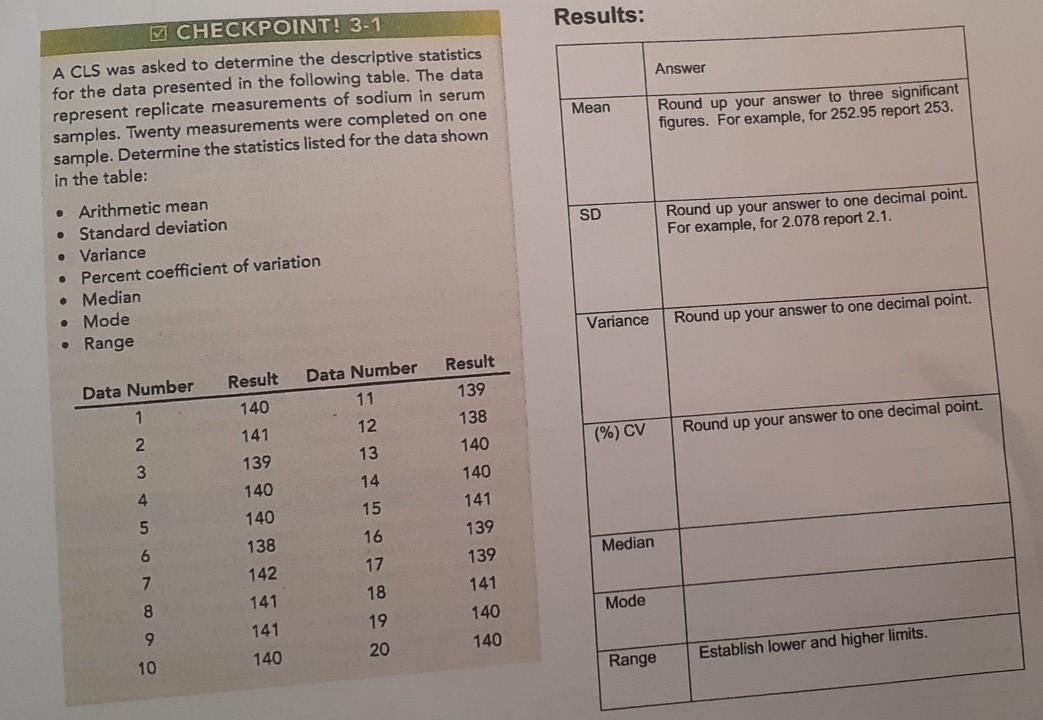
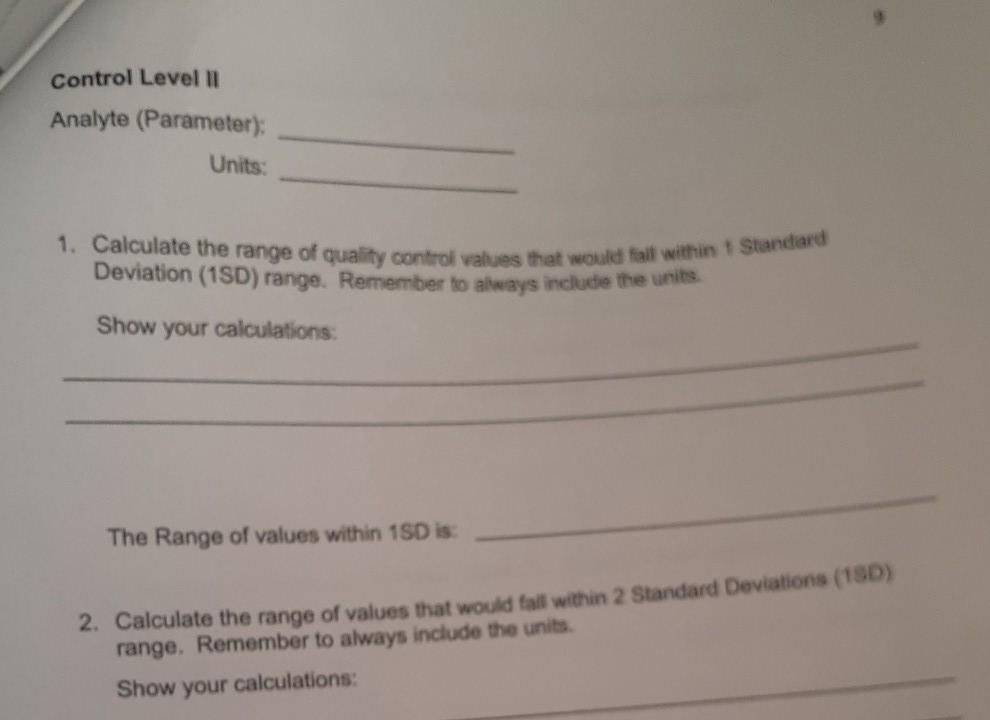
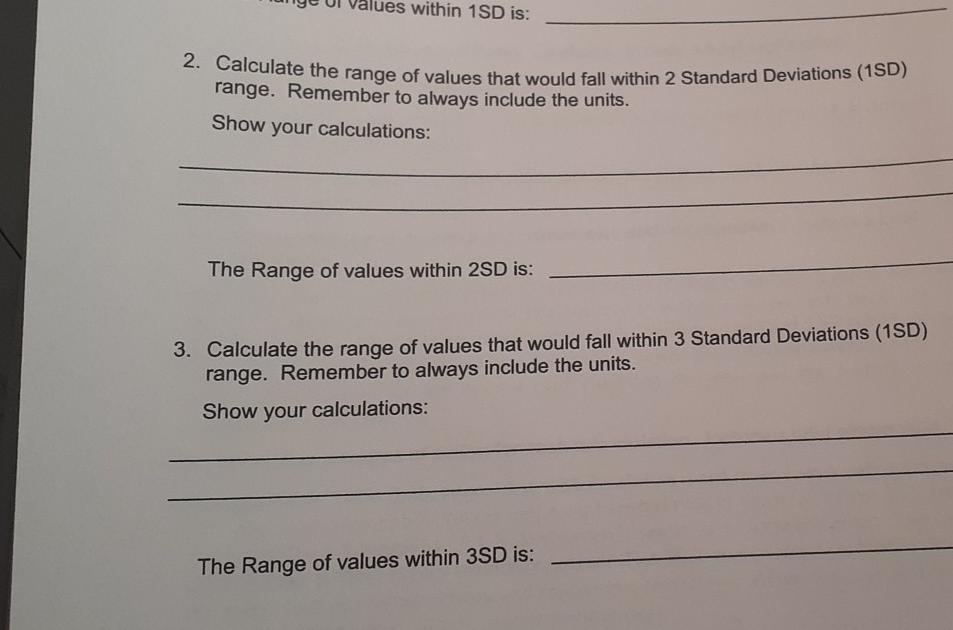
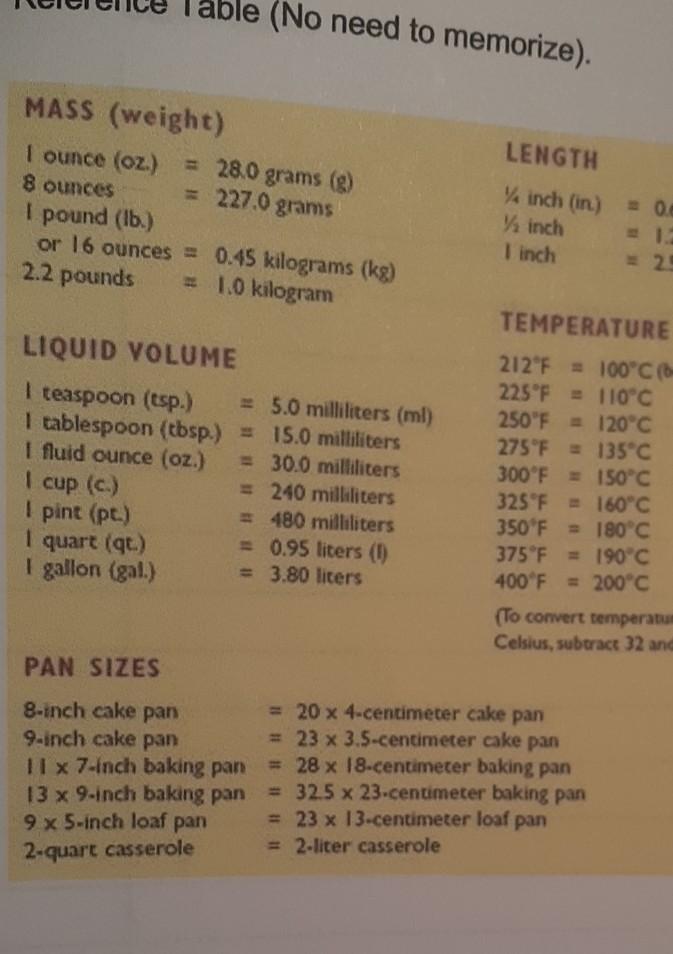
11 2 3 4 5 6 7 8 9 10 Days ations. Include a brief explanation. d with each rule violation. Include a brief -350 = +25D = - 150 = Creatinine (mg/dL) Mean = -1SD - 2SD = -35D = 2 3 4 5 6 7 8 9 10 Days 1. Determine all the Westgard Rules Violations. Include a brief explanation. DV 3 CLE Control Level II Levey Jennings Chart +3SD = +2SD = +1SD Creatinine (mg/dL) Mean = -1SD = -2SD = -3SD = 1 2 3 4 5 6 7 8 5 Days 1. Determine all the Westgard Rules Violations. Include a brief 2. Identify the type of or errors associated with each rule viola leta Days 1. Determine all the Westgard Rules Violations. Include a brief explanation. 2. Identify the type of or errors associated with each rule violation. Include a brief explanation. a 3. Determine a course of action for each rule violation. Include a brief explanation. Control Level II Levey Jennings Chart Reference --Authorization Code: 46. +3SD = +25D = +1SD = Payments Creatinine (mg/dL) Mean = - 1SD = -2SD = -3SD = 2 3 4 5 6 7 8 9 10 Days mee, FL 34741 1 Determine all the Westgard Rules Violations. Include a brief explanation. Results: Answer Mean Round up your answer to three significant figures. For example, for 252.95 report 253. E CHECKPOINT! 3-1 A CLS was asked to determine the descriptive statistics for the data presented in the following table. The data represent replicate measurements of sodium in serum samples. Twenty measurements were completed on one sample. Determine the statistics listed for the data shown in the table: Arithmetic mean Standard deviation Variance Percent coefficient of variation Median Mode Range SD Round up your answer to one decimal point. For example, for 2.078 report 2.1. Variance Round up your answer to one decimal point. Data Number Result 140 141 Data Number 11 Result 139 138 1 (%) CV Round up your answer to one decimal point. 12 13 2 3 14 139 140 140 140 140 141 139 4 15 5 6 16 Median 138 142 17 139 141 7 141 18 19 Mode 8 141 140 140 9 20 140 Range Establish lower and higher limits. 10 Control Level II Analyte (Parameter): Units: 1. Calculate the range of quality control values that would fall within 1 Standard Deviation (1SD) range. Remember to always include the units. Show your calculations: The Range of values within 15D is: 2. Calculate the range of values that would fall within 2 Standard Deviations (150) range. Remember to always include the units Show your calculations: ues within 1 SD is: 2. Calculate the range of values that would fall within 2 Standard Deviations (18D) range. Remember to always include the units. Show your calculations: The Range of values within 2SD is: 3. Calculate the range of values that would fall within 3 Standard Deviations (1SD) range. Remember to always include the units. Show your calculations: The Range of values within 3SD is: able (No need to memorize). MASS (weight) I ounce (oz.) = 28.0 grams (g) 8 ounces = 227.0 grams I pound (Ib.) or 16 ounces = 0.45 kilograms (kg) 2.2 pounds = 1.0 kilogram LENGTH 7 inch (in.) = 0 7 inch 1 inch 2 LIQUID VOLUME I teaspoon (tsp.) = 5.0 milliliters (ml) 1 tablespoon (tbsp.) = 15.0 milliliters I fluid ounce (oz.) = 30.0 milliliters 1 cup (c.) = 240 milliliters pint (pt.) = 480 milliliters 1 quart (qt.) = 0.95 liters (0) I gallon (gal.) = 3.80 liters TEMPERATURE 212 F = 100C 225F = 110C 250"F = 120C 275F = 135C 300F 150C 325F = 160C 350 F = 180C 375F = 190C 400F = 200C (To convert temperatus Celsius, subtract 32 and PAN SIZES 8-inch cake pan 9-inch cake pan 11 x 7-inch baking pan 13 x 9-inch baking pan 9 x 5-inch loaf pan = 20 x 4-centimeter cake pan = 23 x 3.5-centimeter cake pan = 28 x 18-centimeter baking pan = 325 x 23.centimeter baking pan = 23 x 13.centimeter loaf pan = 2-liter casserole 2-quart casserole 11 2 3 4 5 6 7 8 9 10 Days ations. Include a brief explanation. d with each rule violation. Include a brief -350 = +25D = - 150 = Creatinine (mg/dL) Mean = -1SD - 2SD = -35D = 2 3 4 5 6 7 8 9 10 Days 1. Determine all the Westgard Rules Violations. Include a brief explanation. DV 3 CLE Control Level II Levey Jennings Chart +3SD = +2SD = +1SD Creatinine (mg/dL) Mean = -1SD = -2SD = -3SD = 1 2 3 4 5 6 7 8 5 Days 1. Determine all the Westgard Rules Violations. Include a brief 2. Identify the type of or errors associated with each rule viola leta Days 1. Determine all the Westgard Rules Violations. Include a brief explanation. 2. Identify the type of or errors associated with each rule violation. Include a brief explanation. a 3. Determine a course of action for each rule violation. Include a brief explanation. Control Level II Levey Jennings Chart Reference --Authorization Code: 46. +3SD = +25D = +1SD = Payments Creatinine (mg/dL) Mean = - 1SD = -2SD = -3SD = 2 3 4 5 6 7 8 9 10 Days mee, FL 34741 1 Determine all the Westgard Rules Violations. Include a brief explanation. Results: Answer Mean Round up your answer to three significant figures. For example, for 252.95 report 253. E CHECKPOINT! 3-1 A CLS was asked to determine the descriptive statistics for the data presented in the following table. The data represent replicate measurements of sodium in serum samples. Twenty measurements were completed on one sample. Determine the statistics listed for the data shown in the table: Arithmetic mean Standard deviation Variance Percent coefficient of variation Median Mode Range SD Round up your answer to one decimal point. For example, for 2.078 report 2.1. Variance Round up your answer to one decimal point. Data Number Result 140 141 Data Number 11 Result 139 138 1 (%) CV Round up your answer to one decimal point. 12 13 2 3 14 139 140 140 140 140 141 139 4 15 5 6 16 Median 138 142 17 139 141 7 141 18 19 Mode 8 141 140 140 9 20 140 Range Establish lower and higher limits. 10 Control Level II Analyte (Parameter): Units: 1. Calculate the range of quality control values that would fall within 1 Standard Deviation (1SD) range. Remember to always include the units. Show your calculations: The Range of values within 15D is: 2. Calculate the range of values that would fall within 2 Standard Deviations (150) range. Remember to always include the units Show your calculations: ues within 1 SD is: 2. Calculate the range of values that would fall within 2 Standard Deviations (18D) range. Remember to always include the units. Show your calculations: The Range of values within 2SD is: 3. Calculate the range of values that would fall within 3 Standard Deviations (1SD) range. Remember to always include the units. Show your calculations: The Range of values within 3SD is: able (No need to memorize). MASS (weight) I ounce (oz.) = 28.0 grams (g) 8 ounces = 227.0 grams I pound (Ib.) or 16 ounces = 0.45 kilograms (kg) 2.2 pounds = 1.0 kilogram LENGTH 7 inch (in.) = 0 7 inch 1 inch 2 LIQUID VOLUME I teaspoon (tsp.) = 5.0 milliliters (ml) 1 tablespoon (tbsp.) = 15.0 milliliters I fluid ounce (oz.) = 30.0 milliliters 1 cup (c.) = 240 milliliters pint (pt.) = 480 milliliters 1 quart (qt.) = 0.95 liters (0) I gallon (gal.) = 3.80 liters TEMPERATURE 212 F = 100C 225F = 110C 250"F = 120C 275F = 135C 300F 150C 325F = 160C 350 F = 180C 375F = 190C 400F = 200C (To convert temperatus Celsius, subtract 32 and PAN SIZES 8-inch cake pan 9-inch cake pan 11 x 7-inch baking pan 13 x 9-inch baking pan 9 x 5-inch loaf pan = 20 x 4-centimeter cake pan = 23 x 3.5-centimeter cake pan = 28 x 18-centimeter baking pan = 325 x 23.centimeter baking pan = 23 x 13.centimeter loaf pan = 2-liter casserole 2-quart casserole
Step by Step Solution
There are 3 Steps involved in it
Step: 1

Get Instant Access to Expert-Tailored Solutions
See step-by-step solutions with expert insights and AI powered tools for academic success
Step: 2

Step: 3
Ace Your Homework with AI
Get the answers you need in no time with our AI-driven, step-by-step assistance
Get Started
Organic Chemistry
Authors: Graham Solomons, Craig Fryhle, Scott Snyder
11th edition
1118133579, 978-1118133576