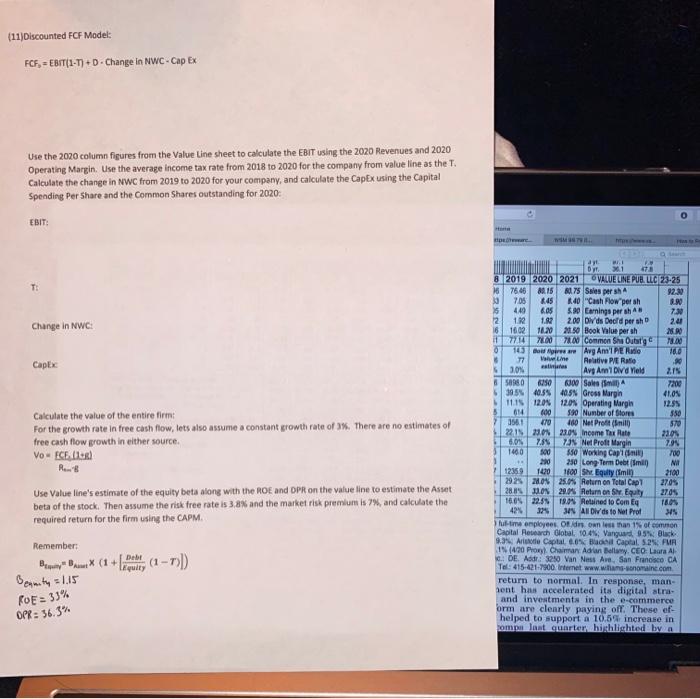
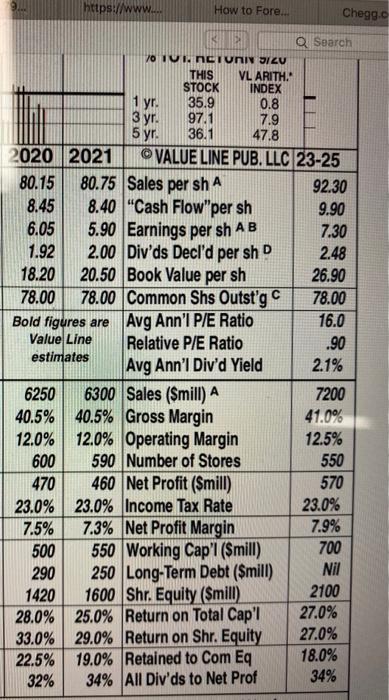
(11) Discounted FCF Model: FCF - EBIT(1-7)+D. Change in NWC- Cap EX Use the 2020 column figures from the Value Line sheet to calculate the EBIT using the 2020 Revenues and 2020 Operating Margin. Use the average income tax rate from 2018 to 2020 for the company from value line as the T. Calculate the change in NWC from 2019 to 2020 for your company, and calculate the Capex using the Capital Spending Per Share and the Common Shares outstanding for 2020 O EBIT: E T: Change in NWC Capex 30 Calculate the value of the entire firm For the growth rate in free cash flow, lets also assume a constant growth rate of %. There are no estimates of free cash flow growth in either source Vo FCE ORI Ros Use Value line's estimate of the equity beta along with the ROE and DPR on the value line to estimate the Asset beta of the stock. Then assume the risk tree rate is 3.8% and the market risk premium is 7%, and calculate the required return for the firm using the CAPM . ! Dyr wi 8 2019 2020 2021 VALUE LINE PUB, LLC 23-25 7646 08.15 B075 Sales per sh 92.30 10 7.06 245 40 "Cash Flowper sh . 449 cos 590 Earnings per sh 730 12 1.12 182 200 Dids Deeld per sho 2.21 16 1602 11.30 21.50 Book Value per sh 28.80 1 7710 7100 Common She Oitatge 78.00 15 do we are Avg Ann'I PER we Relative PER . 5 3.ON Avg Ann Did Yield 2.15 8500 6250 300 Sale 7200 530-5403 40.55 Gross Margin 41.05 11151205 120% Operating Margin 12.55 8 614 600 580 Number of Stores 550 470 100 Net Profit (nilo 570 22.15 2.0 2005 Income Tax Rate 2105 6.05 7.84 7. Net Proft Margin 7.95 1460 sod 550 Working Capimi 700 220 250 Long Term Debt min 12359 1420 1800 ShEquity (min 2100 292 209 25.0% Return on Total Capi 27.05 28.5 11.0 29.0 Return on Sv. Equity 2705 160 22.819:04 Retained to Com q TO 42% 325 All Wds to Net Prof 34% ul-time employees. Olds. On less than 1 of common Capital Research Global 10.4% Vanguard 95% Black 9.3 Arte Captal 6.6% Be Capital. 52 FMA 19 (420 Proxyl Chaima Adrian Bellamy CEO: Laura AB .: DE Addr: 32:50 Van Ness Ave, San Francisco CA Tel: 415-421-7900 Internet www.womain.com return to normal. In response, man- sent hus accelerated its digital atra- and investments in the e-commerce orm are clearly paying off. These ef- helped to support a 10.5% increase in rompu last quarter highlighted by a Remember: Debr Beanity = 1.15 ROE = 33% OPR: 56.5% How to Fore. Search 1 yr. 3 yr. https://www... Chegg.c USE 70 IUI, NETURI JIZU THIS VL ARITH. STOCK INDEX 35.9 0.8 97.1 7.9 5 yr. 36.1 47.8 2020 2021 VALUE LINE PUB. LLC 23-25 80.15 80.75 Sales per sh A 92.30 8.45 8.40 "Cash Flow"per sh 9.90 6.05 5.90 Earnings per sh AB 7.30 1.92 2.00 Div'ds Decl'd per shD 2.48 18.20 20.50 Book Value per sh 26.90 78.00 78.00 Common Shs Outst'g C 78.00 Bold figures are Avg Ann'I P/E Ratio 16.0 Value Line Relative P/E Ratio .90 estimates Avg Ann'l Div'd Yield 2.1% 6250 6300 Sales (Smill) A 7200 40.5% 40.5% Gross Margin 41.0% 12.0% 12.0% Operating Margin 12.5% 600 590 Number of Stores 550 470 460 Net Profit (Smill) 570 23.0% 23.0% Income Tax Rate 23.0% 7.5% 7.3% Net Profit Margin 7.9% 500 550 Working Cap'l (Smill) 700 290 250 Long-Term Debt ($mill) Nil 1420 1600 Shr. Equity (Smill) 2100 28.0% 25.0% Return on Total Cap'l 27.0% 33.0% 29.0% Return on Shr. Equity 27.0% 22.5% 19.0% Retained to Com Eq 18.0% 32% 34% All Div'ds to Net Prof 34% (11) Discounted FCF Model: FCF - EBIT(1-7)+D. Change in NWC- Cap EX Use the 2020 column figures from the Value Line sheet to calculate the EBIT using the 2020 Revenues and 2020 Operating Margin. Use the average income tax rate from 2018 to 2020 for the company from value line as the T. Calculate the change in NWC from 2019 to 2020 for your company, and calculate the Capex using the Capital Spending Per Share and the Common Shares outstanding for 2020 O EBIT: E T: Change in NWC Capex 30 Calculate the value of the entire firm For the growth rate in free cash flow, lets also assume a constant growth rate of %. There are no estimates of free cash flow growth in either source Vo FCE ORI Ros Use Value line's estimate of the equity beta along with the ROE and DPR on the value line to estimate the Asset beta of the stock. Then assume the risk tree rate is 3.8% and the market risk premium is 7%, and calculate the required return for the firm using the CAPM . ! Dyr wi 8 2019 2020 2021 VALUE LINE PUB, LLC 23-25 7646 08.15 B075 Sales per sh 92.30 10 7.06 245 40 "Cash Flowper sh . 449 cos 590 Earnings per sh 730 12 1.12 182 200 Dids Deeld per sho 2.21 16 1602 11.30 21.50 Book Value per sh 28.80 1 7710 7100 Common She Oitatge 78.00 15 do we are Avg Ann'I PER we Relative PER . 5 3.ON Avg Ann Did Yield 2.15 8500 6250 300 Sale 7200 530-5403 40.55 Gross Margin 41.05 11151205 120% Operating Margin 12.55 8 614 600 580 Number of Stores 550 470 100 Net Profit (nilo 570 22.15 2.0 2005 Income Tax Rate 2105 6.05 7.84 7. Net Proft Margin 7.95 1460 sod 550 Working Capimi 700 220 250 Long Term Debt min 12359 1420 1800 ShEquity (min 2100 292 209 25.0% Return on Total Capi 27.05 28.5 11.0 29.0 Return on Sv. Equity 2705 160 22.819:04 Retained to Com q TO 42% 325 All Wds to Net Prof 34% ul-time employees. Olds. On less than 1 of common Capital Research Global 10.4% Vanguard 95% Black 9.3 Arte Captal 6.6% Be Capital. 52 FMA 19 (420 Proxyl Chaima Adrian Bellamy CEO: Laura AB .: DE Addr: 32:50 Van Ness Ave, San Francisco CA Tel: 415-421-7900 Internet www.womain.com return to normal. In response, man- sent hus accelerated its digital atra- and investments in the e-commerce orm are clearly paying off. These ef- helped to support a 10.5% increase in rompu last quarter highlighted by a Remember: Debr Beanity = 1.15 ROE = 33% OPR: 56.5% How to Fore. Search 1 yr. 3 yr. https://www... Chegg.c USE 70 IUI, NETURI JIZU THIS VL ARITH. STOCK INDEX 35.9 0.8 97.1 7.9 5 yr. 36.1 47.8 2020 2021 VALUE LINE PUB. LLC 23-25 80.15 80.75 Sales per sh A 92.30 8.45 8.40 "Cash Flow"per sh 9.90 6.05 5.90 Earnings per sh AB 7.30 1.92 2.00 Div'ds Decl'd per shD 2.48 18.20 20.50 Book Value per sh 26.90 78.00 78.00 Common Shs Outst'g C 78.00 Bold figures are Avg Ann'I P/E Ratio 16.0 Value Line Relative P/E Ratio .90 estimates Avg Ann'l Div'd Yield 2.1% 6250 6300 Sales (Smill) A 7200 40.5% 40.5% Gross Margin 41.0% 12.0% 12.0% Operating Margin 12.5% 600 590 Number of Stores 550 470 460 Net Profit (Smill) 570 23.0% 23.0% Income Tax Rate 23.0% 7.5% 7.3% Net Profit Margin 7.9% 500 550 Working Cap'l (Smill) 700 290 250 Long-Term Debt ($mill) Nil 1420 1600 Shr. Equity (Smill) 2100 28.0% 25.0% Return on Total Cap'l 27.0% 33.0% 29.0% Return on Shr. Equity 27.0% 22.5% 19.0% Retained to Com Eq 18.0% 32% 34% All Div'ds to Net Prof 34%


