

Answered step by step
Verified Expert Solution
Question
1 Approved Answer
(11) The average number of customers being served: r For nearly all queuing systems, there is a relationship between the average time a unit spends
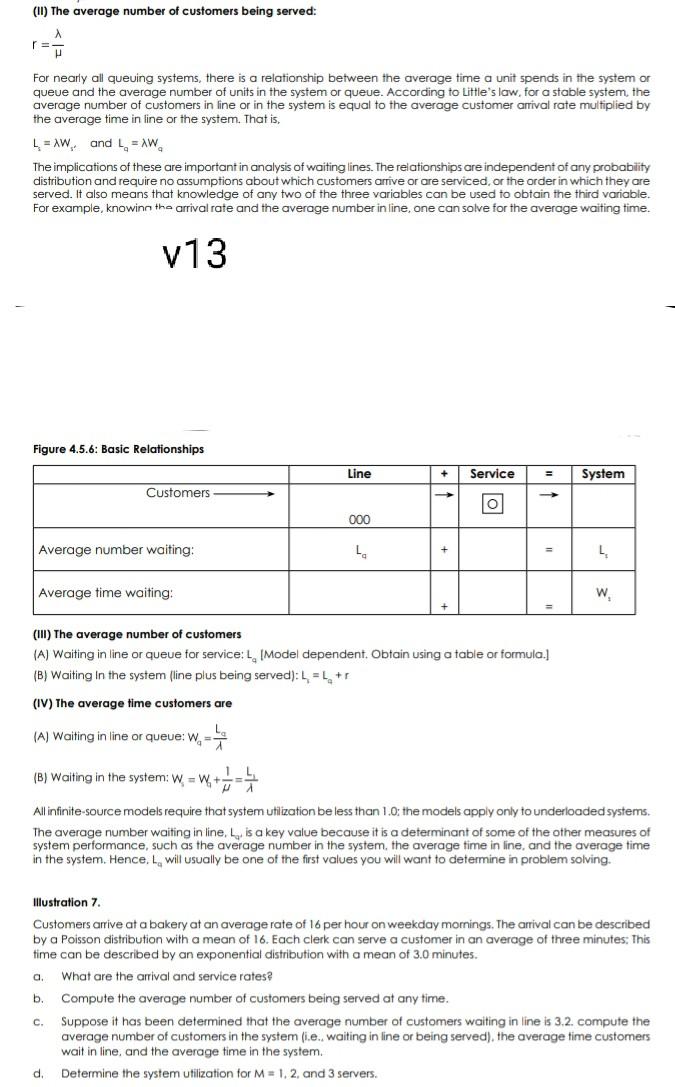
(11) The average number of customers being served: r For nearly all queuing systems, there is a relationship between the average time a unit spends in the system or queue and the average number of units in the system or queue. According to Little's law, for a stable system, the average number of customers in line or in the system is equal to the average customer arrival rate multiplied by the average time in line or the system. That is, L = Wand LAW The implications of these are important in analysis of waiting lines. The relationships are independent of any probability distribution and require no assumptions about which customers arrive or are serviced, or the order in which they are served. It also means that knowledge of any two of the three variables can be used to obtain the third variable. For example, knowing the arrival rate and the average number in line, one can solve for the average waiting time. V13 Figure 4.5.6: Basic Relationships Line + Service System Customers O 000 Average number waiting: L. = Average time waiting: W (III) The average number of customers (A) Waiting in line or queue for service: Model dependent. Obtain using a table or formula. (B) Waiting in the system (line plus being served): L=L+ (IV) The average time customers are (A) Waiting in line or queue: W= (B) Waiting in the system: W= 1 All infinite-source models require that system utilization be less than 1.0: the models apply only to underloaded systems. The average number waiting in line, L. is a key value because it is a determinant of some of the other measures of system performance, such as the average number in the system, the average time in line, and the average time in the system. Hence. I will usually be one of the first values you will want to determine in problem solving. a. Illustration 7 Customers arrive at a bakery at an average rate of 16 per hour on weekday mornings. The arrival can be described by a Poisson distribution with a mean of 16. Each clerk can serve a customer in an average of three minutes. This time can be described by an exponential distribution with a mean of 3.0 minutes. What are the arrival and service rates b. Compute the average number of customers being served at any time. Suppose it has been determined that the average number of customers waiting in line is 3.2. compute the average number of customers in the system (i.e. waiting in line or being served), the average time customers wait in line, and the average time in the system. d. Determine the system utilization for M = 1.2 and 3 servers. C
Step by Step Solution
There are 3 Steps involved in it
Step: 1

Get Instant Access to Expert-Tailored Solutions
See step-by-step solutions with expert insights and AI powered tools for academic success
Step: 2

Step: 3
Ace Your Homework with AI
Get the answers you need in no time with our AI-driven, step-by-step assistance
Get Started
Managerial Accounting Tools For Business Decision Making
Authors: Weygandt, Kimmel, Kieso
4th Edition
0470478535, 978-0470478530