#11-18
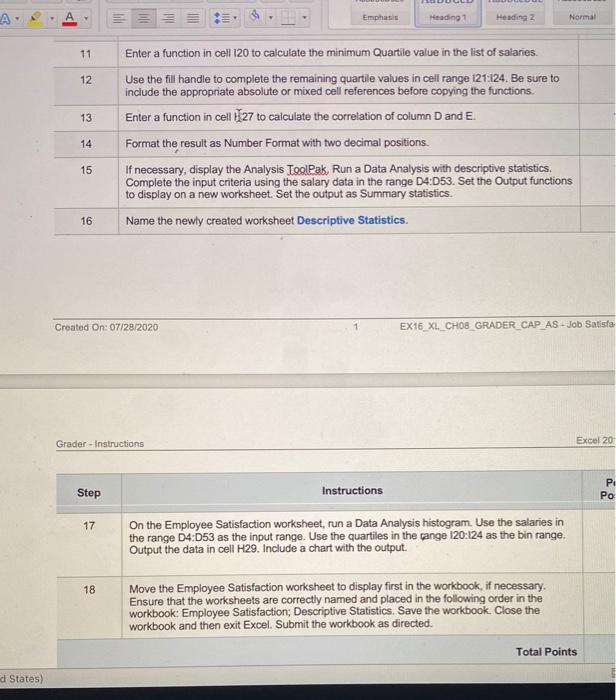
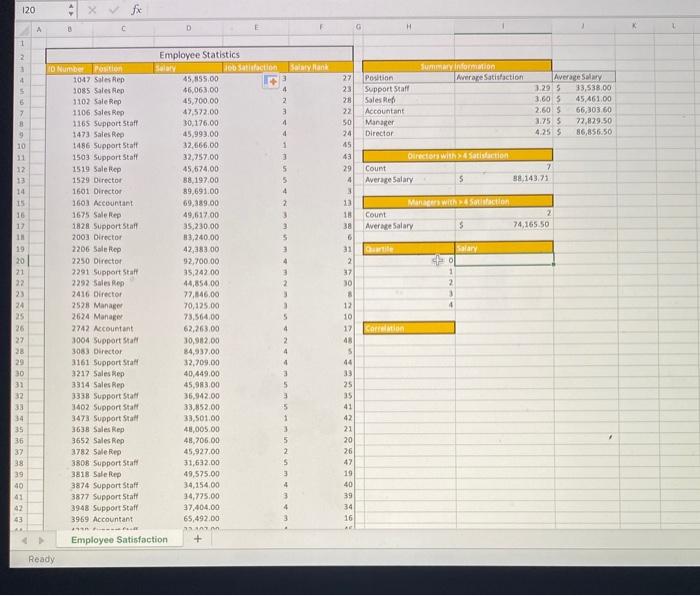
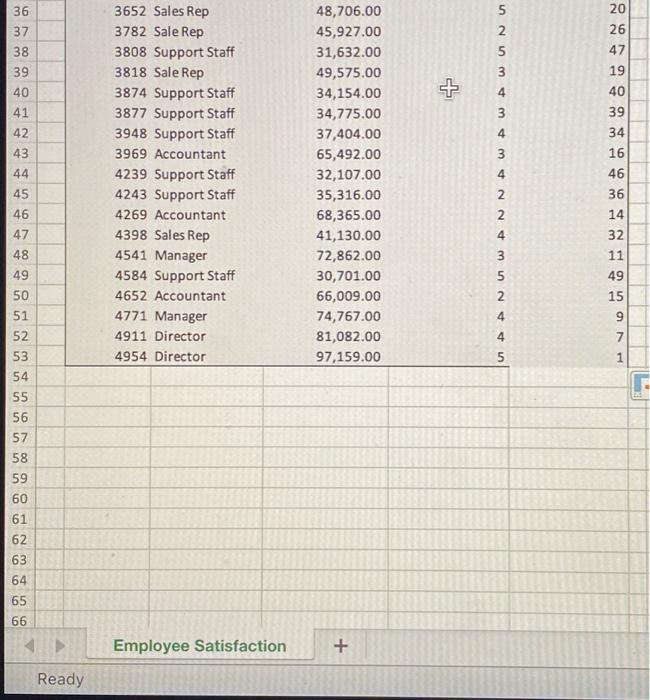
Emphasis Heading Heading 2 Normal 11 12 13 Enter a function in cell 120 to calculate the minimum Quartile value in the list of salaries. Use the fill handle to complete the remaining quartile values in cell range 121:124. Be sure to include the appropriate absolute or mixed cell references before copying the functions. Enter a function in cell 127 to calculate the correlation of column D and E. Format the result as Number Format with two decimal positions. If necessary, display the Analysis ToolPak Run a Data Analysis with descriptive statistics, Complete the input criteria using the salary data in the range 04:053. Set the Output functions to display on a new worksheet Set the output as Summary statistics. Name the newly created worksheet Descriptive Statistics. 14 15 16 Created On: 07/28/2020 EX16 XL CHOB GRADER CAP AS - Job Satisfa Grader - Instructions Excel 20 Step Instructions P Po 17 On the Employee Satisfaction worksheet, run a Data Analysis histogram. Use the salaries in the range 04:053 as the input range. Use the quartiles in the gange 120:124 as the bin range. Output the data in cell H29. Include a chart with the output. 18 Move the Employee Satisfaction worksheet to display first in the workbook, if necessary. Ensure that the worksheets are correctly named and placed in the following order in the workbook: Employee Satisfaction: Descriptive Statistics. Save the workbook. Close the workbook and then exit Excel. Submit the workbook as directed Total Points d States) 120 ex fx A c H 1 Balstyan Summary Information Averare Satisfaction 4 2 3 4 4 1 3 5 5 Position Support Staff Sales Rep Accountant Manager Director Average Salary 3.295 33,538,00 3.60 5 45,461.00 2.60 5 66,303.60 1.755 72,829.50 4.25 5 86,856.50 Oirectors with 4 Satisfaction Count Average Salary 5 7 88,143.73 4 2 3 3 Manager with 4 Soustaction Count Average Salary 5 2 74,165.50 Salary 0 1 2 2 3 4 5 6 7 3 9 10 11 12 13 14 15 16 17 IN 19 20 21 22 23 24 25 26 27 28 29 30 31 32 33 34 35 36 37 38 39 40 41 42 43 A Employee Statistics Salary Satisfaction 45.855.00 46,063.00 45,700.00 47.572.00 30,176.00 45,993,00 32.666.00 32,757.00 45.674.00 88.197.00 89,691.00 69,389.00 49,617.00 35,230.00 83,240.00 42,383 00 92,700.00 35,242.00 44,854.00 77,546.00 70,125.00 73,564.00 62,263.00 30,982,00 84,937.00 32,709,00 40,449,00 45,983.00 36,942.00 33,852.00 33,501.00 48,005.00 48,706.00 45,927.00 31,632.00 49,575,00 34,154.00 34,725.00 37.404.00 65,492.00 2 10 Number Position 1047 Sales Rep 3085 Sales Rep 1102 Sale Rep 1106 Sales Rep 1165 support Stoff 1473 Sales Rep 1486 Support Staff 1503 Support Staff 1519 Sale Rep 1529 Director 1601 Director 1601 Accountant 1675 Sale Rep 1828 Support Stall 2003 Director 2206 Sleep 2250 Director 7291 Support Staff 2292 Sales Rep 2416 Director 2528 Manager 2624 Manager 2742 Accountant 3004 Support Stall 3083 Director 3161 Support Stall 3217 Sales Rep 3314 Sales Rep 3338 Support Staff 3402 Support Stall 3473 Support Staff 3638 Sales Rep 3652 Sales Rep 3782 Sale Rep 3808 Support Staff 3818 Sale Rep 3874 Support Staff 3877 Support Stall 3948 Support Staff 3969 Accountant 27 23 28 22 50 24 45 43 29 4 3 13 18 38 6 31 2 37 30 8 12 10 17 48 5 44 33 25 35 41 42 21 20 26 47 19 40 39 34 16 1 Cortion 5 4 2 4 4 3 5 3 5 1 . 5 2 5 3 4 Employee Satisfaction + Ready 3 5 2 5 36 37 38 39 40 41 42 43 44 20 26 47 19 40 3 + 4 4 4 4 4 3652 Sales Rep 3782 Sale Rep 3808 Support Staff 3818 Sale Rep 3874 Support Staff 3877 Support Staff 3948 Support Staff 3969 Accountant 4239 Support Staff 4243 Support Staff 4269 Accountant 4398 Sales Rep 4541 Manager 4584 Support Staff 4652 Accountant 4771 Manager 4911 Director 4954 Director 48,706.00 45,927.00 31,632.00 49,575.00 34,154.00 34,775.00 37,404.00 65,492.00 32,107.00 35,316.00 68,365.00 41,130.00 72,862.00 30,701.00 66,009.00 74,767.00 81,082.00 97,159.00 39 34 16 46 36 14 32 11 49 5 6 4 3 2 3 N N N in 5 15 4 9 4 7 1 46 47 48 49 50 51 52 53 54 55 56 57 58 59 60 61 62 63 64 65 66 Employee Satisfaction + Ready Emphasis Heading Heading 2 Normal 11 12 13 Enter a function in cell 120 to calculate the minimum Quartile value in the list of salaries. Use the fill handle to complete the remaining quartile values in cell range 121:124. Be sure to include the appropriate absolute or mixed cell references before copying the functions. Enter a function in cell 127 to calculate the correlation of column D and E. Format the result as Number Format with two decimal positions. If necessary, display the Analysis ToolPak Run a Data Analysis with descriptive statistics, Complete the input criteria using the salary data in the range 04:053. Set the Output functions to display on a new worksheet Set the output as Summary statistics. Name the newly created worksheet Descriptive Statistics. 14 15 16 Created On: 07/28/2020 EX16 XL CHOB GRADER CAP AS - Job Satisfa Grader - Instructions Excel 20 Step Instructions P Po 17 On the Employee Satisfaction worksheet, run a Data Analysis histogram. Use the salaries in the range 04:053 as the input range. Use the quartiles in the gange 120:124 as the bin range. Output the data in cell H29. Include a chart with the output. 18 Move the Employee Satisfaction worksheet to display first in the workbook, if necessary. Ensure that the worksheets are correctly named and placed in the following order in the workbook: Employee Satisfaction: Descriptive Statistics. Save the workbook. Close the workbook and then exit Excel. Submit the workbook as directed Total Points d States) 120 ex fx A c H 1 Balstyan Summary Information Averare Satisfaction 4 2 3 4 4 1 3 5 5 Position Support Staff Sales Rep Accountant Manager Director Average Salary 3.295 33,538,00 3.60 5 45,461.00 2.60 5 66,303.60 1.755 72,829.50 4.25 5 86,856.50 Oirectors with 4 Satisfaction Count Average Salary 5 7 88,143.73 4 2 3 3 Manager with 4 Soustaction Count Average Salary 5 2 74,165.50 Salary 0 1 2 2 3 4 5 6 7 3 9 10 11 12 13 14 15 16 17 IN 19 20 21 22 23 24 25 26 27 28 29 30 31 32 33 34 35 36 37 38 39 40 41 42 43 A Employee Statistics Salary Satisfaction 45.855.00 46,063.00 45,700.00 47.572.00 30,176.00 45,993,00 32.666.00 32,757.00 45.674.00 88.197.00 89,691.00 69,389.00 49,617.00 35,230.00 83,240.00 42,383 00 92,700.00 35,242.00 44,854.00 77,546.00 70,125.00 73,564.00 62,263.00 30,982,00 84,937.00 32,709,00 40,449,00 45,983.00 36,942.00 33,852.00 33,501.00 48,005.00 48,706.00 45,927.00 31,632.00 49,575,00 34,154.00 34,725.00 37.404.00 65,492.00 2 10 Number Position 1047 Sales Rep 3085 Sales Rep 1102 Sale Rep 1106 Sales Rep 1165 support Stoff 1473 Sales Rep 1486 Support Staff 1503 Support Staff 1519 Sale Rep 1529 Director 1601 Director 1601 Accountant 1675 Sale Rep 1828 Support Stall 2003 Director 2206 Sleep 2250 Director 7291 Support Staff 2292 Sales Rep 2416 Director 2528 Manager 2624 Manager 2742 Accountant 3004 Support Stall 3083 Director 3161 Support Stall 3217 Sales Rep 3314 Sales Rep 3338 Support Staff 3402 Support Stall 3473 Support Staff 3638 Sales Rep 3652 Sales Rep 3782 Sale Rep 3808 Support Staff 3818 Sale Rep 3874 Support Staff 3877 Support Stall 3948 Support Staff 3969 Accountant 27 23 28 22 50 24 45 43 29 4 3 13 18 38 6 31 2 37 30 8 12 10 17 48 5 44 33 25 35 41 42 21 20 26 47 19 40 39 34 16 1 Cortion 5 4 2 4 4 3 5 3 5 1 . 5 2 5 3 4 Employee Satisfaction + Ready 3 5 2 5 36 37 38 39 40 41 42 43 44 20 26 47 19 40 3 + 4 4 4 4 4 3652 Sales Rep 3782 Sale Rep 3808 Support Staff 3818 Sale Rep 3874 Support Staff 3877 Support Staff 3948 Support Staff 3969 Accountant 4239 Support Staff 4243 Support Staff 4269 Accountant 4398 Sales Rep 4541 Manager 4584 Support Staff 4652 Accountant 4771 Manager 4911 Director 4954 Director 48,706.00 45,927.00 31,632.00 49,575.00 34,154.00 34,775.00 37,404.00 65,492.00 32,107.00 35,316.00 68,365.00 41,130.00 72,862.00 30,701.00 66,009.00 74,767.00 81,082.00 97,159.00 39 34 16 46 36 14 32 11 49 5 6 4 3 2 3 N N N in 5 15 4 9 4 7 1 46 47 48 49 50 51 52 53 54 55 56 57 58 59 60 61 62 63 64 65 66 Employee Satisfaction + Ready