11.2
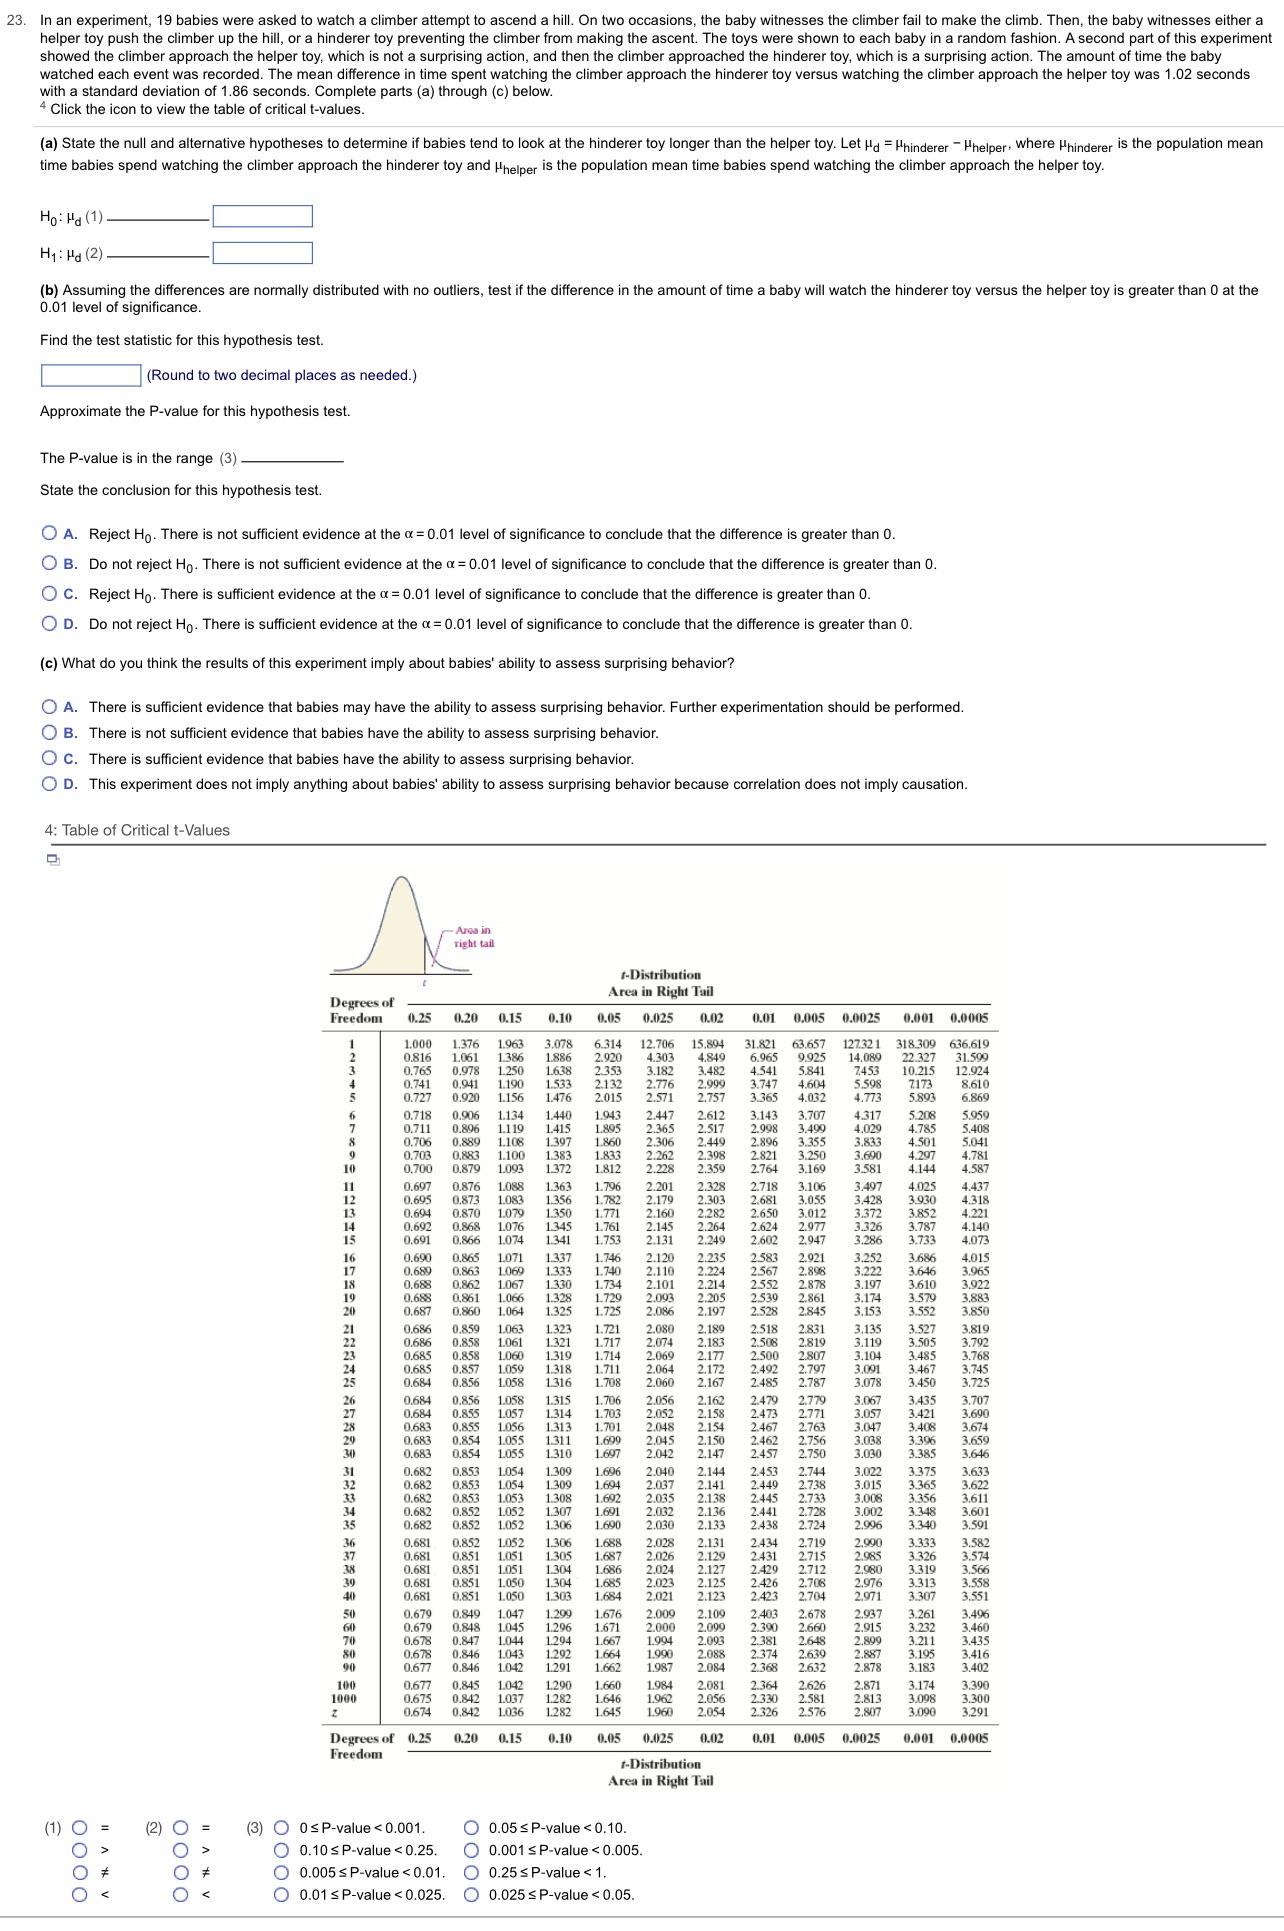
23. In an experiment, 19 babies were asked to watch a climber attempt to ascend a hill. On two occasions, the baby witnesses the climber fail to make the climb. Then, the baby witnesses either a helper toy push the climber up the hill, or a hinderer toy preventing the climber from making the ascent. The toys were shown to each baby in a random fashion. A second part of this experiment showed the climber approach the helper toy, which is not a surprising action, and then the climber approached the hinderer toy, which is a surprising action. The amount of time the baby watched each event was recorded. The mean difference in time spent watching the climber approach the hinderer toy versus watching the climber approach the helper toy was 1.02 seconds with a standard deviation of 1.86 seconds. Complete parts (a) through (c) below. Click the icon to view the table of critical t-values. (a) State the null and alternative hypotheses to determine if babies tend to look at the hinderer toy longer than the helper toy. Let Hd = Hhinderer - Hhelper, where "hinderer is the population mean time babies spend watching the climber approach the hinderer toy and Hhelper is the population mean time babies spend watching the climber approach the helper toy. Ho: Ha (1) H1: Hg (2) (b) Assuming the differences are normally distributed with no outliers, test if the difference in the amount of time a baby will watch the hinderer toy versus the helper toy is greater than 0 at the 0.01 level of significance Find the test statistic for this hypothesis test. (Round to two decimal places as needed.) Approximate the P-value for this hypothesis test. The P-value is in the range (3 State the conclusion for this hypothesis test. O A. Reject Ho. There is not sufficient evidence at the o = 0.01 level of significance to conclude that the difference is greater than 0. O B. Do not reject Ho. There is not sufficient evidence at the o = 0.01 level of significance to conclude that the difference is greater than 0. O C. Reject Ho. There is sufficient evidence at the a = 0.01 level of significance to conclude that the difference is greater than 0. O D. Do not reject Ho. There is sufficient evidence at the a = 0.01 level of significance to conclude that the difference is greater than 0. (c) What do you think the results of this experiment imply about babies' ability to assess surprising behavior? O A. There is sufficient evidence that babies may have the ability to assess surprising behavior. Further experimentation should be performed. O B. There is not sufficient evidence that babies have the ability to assess surprising behavior. O C. There is sufficient evidence that babies have the ability to assess surprising behavior. O D. This experiment does not imply anything about babies' ability to assess surprising behavior because correlation does not imply causation. 4: Table of Critical t-Values - Area in right tail f-Distribution Degrees of Area in Right Tail Freedom 0.20 0.15 0.10 0.05 0.025 0.02 0.01 0.005 0.0025 0.001 0.0005 1.000 1.376 1.963 3.078 2.706 15.89 31.821 63.657 $18.309 636.619 0.816 4.303 4.849 9.925 14.089 22.327 31.599 0.765 0.978 3 . 18 2 5 841 7.453 10.215 12.924 0.741 0.941 1.190 1.533 2.132 2 . 776 2.909 3.747 5.598 7173 8.610 0.727 0.920 1.156 1.476 2.015 2.571 2.757 3.365 4.032 4.773 5.893 6.869 0.718 0.906 1.134 1.440 1.943 2.447 2.612 3.707 4.317 5.959 1.119 1.415 2.365 2.517 2.998 3.490 4.029 4.785 5. 408 0.706 0.806 2.306 2.896 3.355 3.833 4 501 3.041 0.703 0.883 1.100 1.833 2.262 2.821 3.250 3.690 4.207 0.700 0.879 1093 1.372 1.812 2.228 2.359 2.764 3.581 4.144 4.587 0.697 1088 2.201 4.025 0.695 0.873 LOTS 2.179 3.930 0.692 2.145 3.852 3.787 0.691 0.866 1.753 2.131 3.733 4.073 0.690 0.865 1.337 1.746 2.120 2.235 4.015 2.110 2.101 2.086 2.197 1.721 2.080 2.074 2.189 2518 2.831 3.527 2.807 3.505 3.819 2.819 2.069 2.064 2.492 2.797 1.708 2.060 2.167 2.485 3.078 3.450 3.725 2.056 2.779 3.435 3.707 2.052 3.057 3.421 2.048 1.607 2.042 2.457 3.030 1.696 2.040 2.144 2.453 2.744 3.022 3.633 3.622 2.035 2.445 0.852 1.852 690 2.030 2.133 2438 1.052 2.028 2.131 3.333 1.051 1.687 2.026 2434 2.719 2.129 2431 2.715 3. 326 3.319 3.574 1.051 2.024 2.429 1.050 2.023 2.125 2426 3.313 0.681 0.851 1.050 1.684 2.021 2.123 2423 2.976 2.704 2.971 3.307 3.551 0.679 0.849 1.047 1.676 2.009 2.109 2.403 2.678 2.937 3.261 3.496 0.679 1.045 2.000 2.915 3.232 0.678 0.678 0.846 1.043 3.195 0.677 0.846 1.042 2.632 2.878 3.183 3.402 0.677 0.845 1.042 1.290 1.660 2.081 2.364 2.626 2.871 3.174 3.390 0.675 0.842 1.037 1.282 1.646 1.962 2.056 2.330 0.674 0.842 1.036 2.326 5396 3.098 3.300 1.282 1.645 1.960 3.090 3.291 Degrees of 0.25 0.20 0.15 0.10 0.05 0.025 0.02 0.01 0.005 0.0025 0.001 0.0005 Freedom t-Distribution Area in Right Tail (1) (2) (3) O OSP-value