116 134 162 71 3-16. Wageweb.c0m exhibits salary data obtained from 181 110 105 74 surveys. It provides compensation information on over 170 benchmark positions,
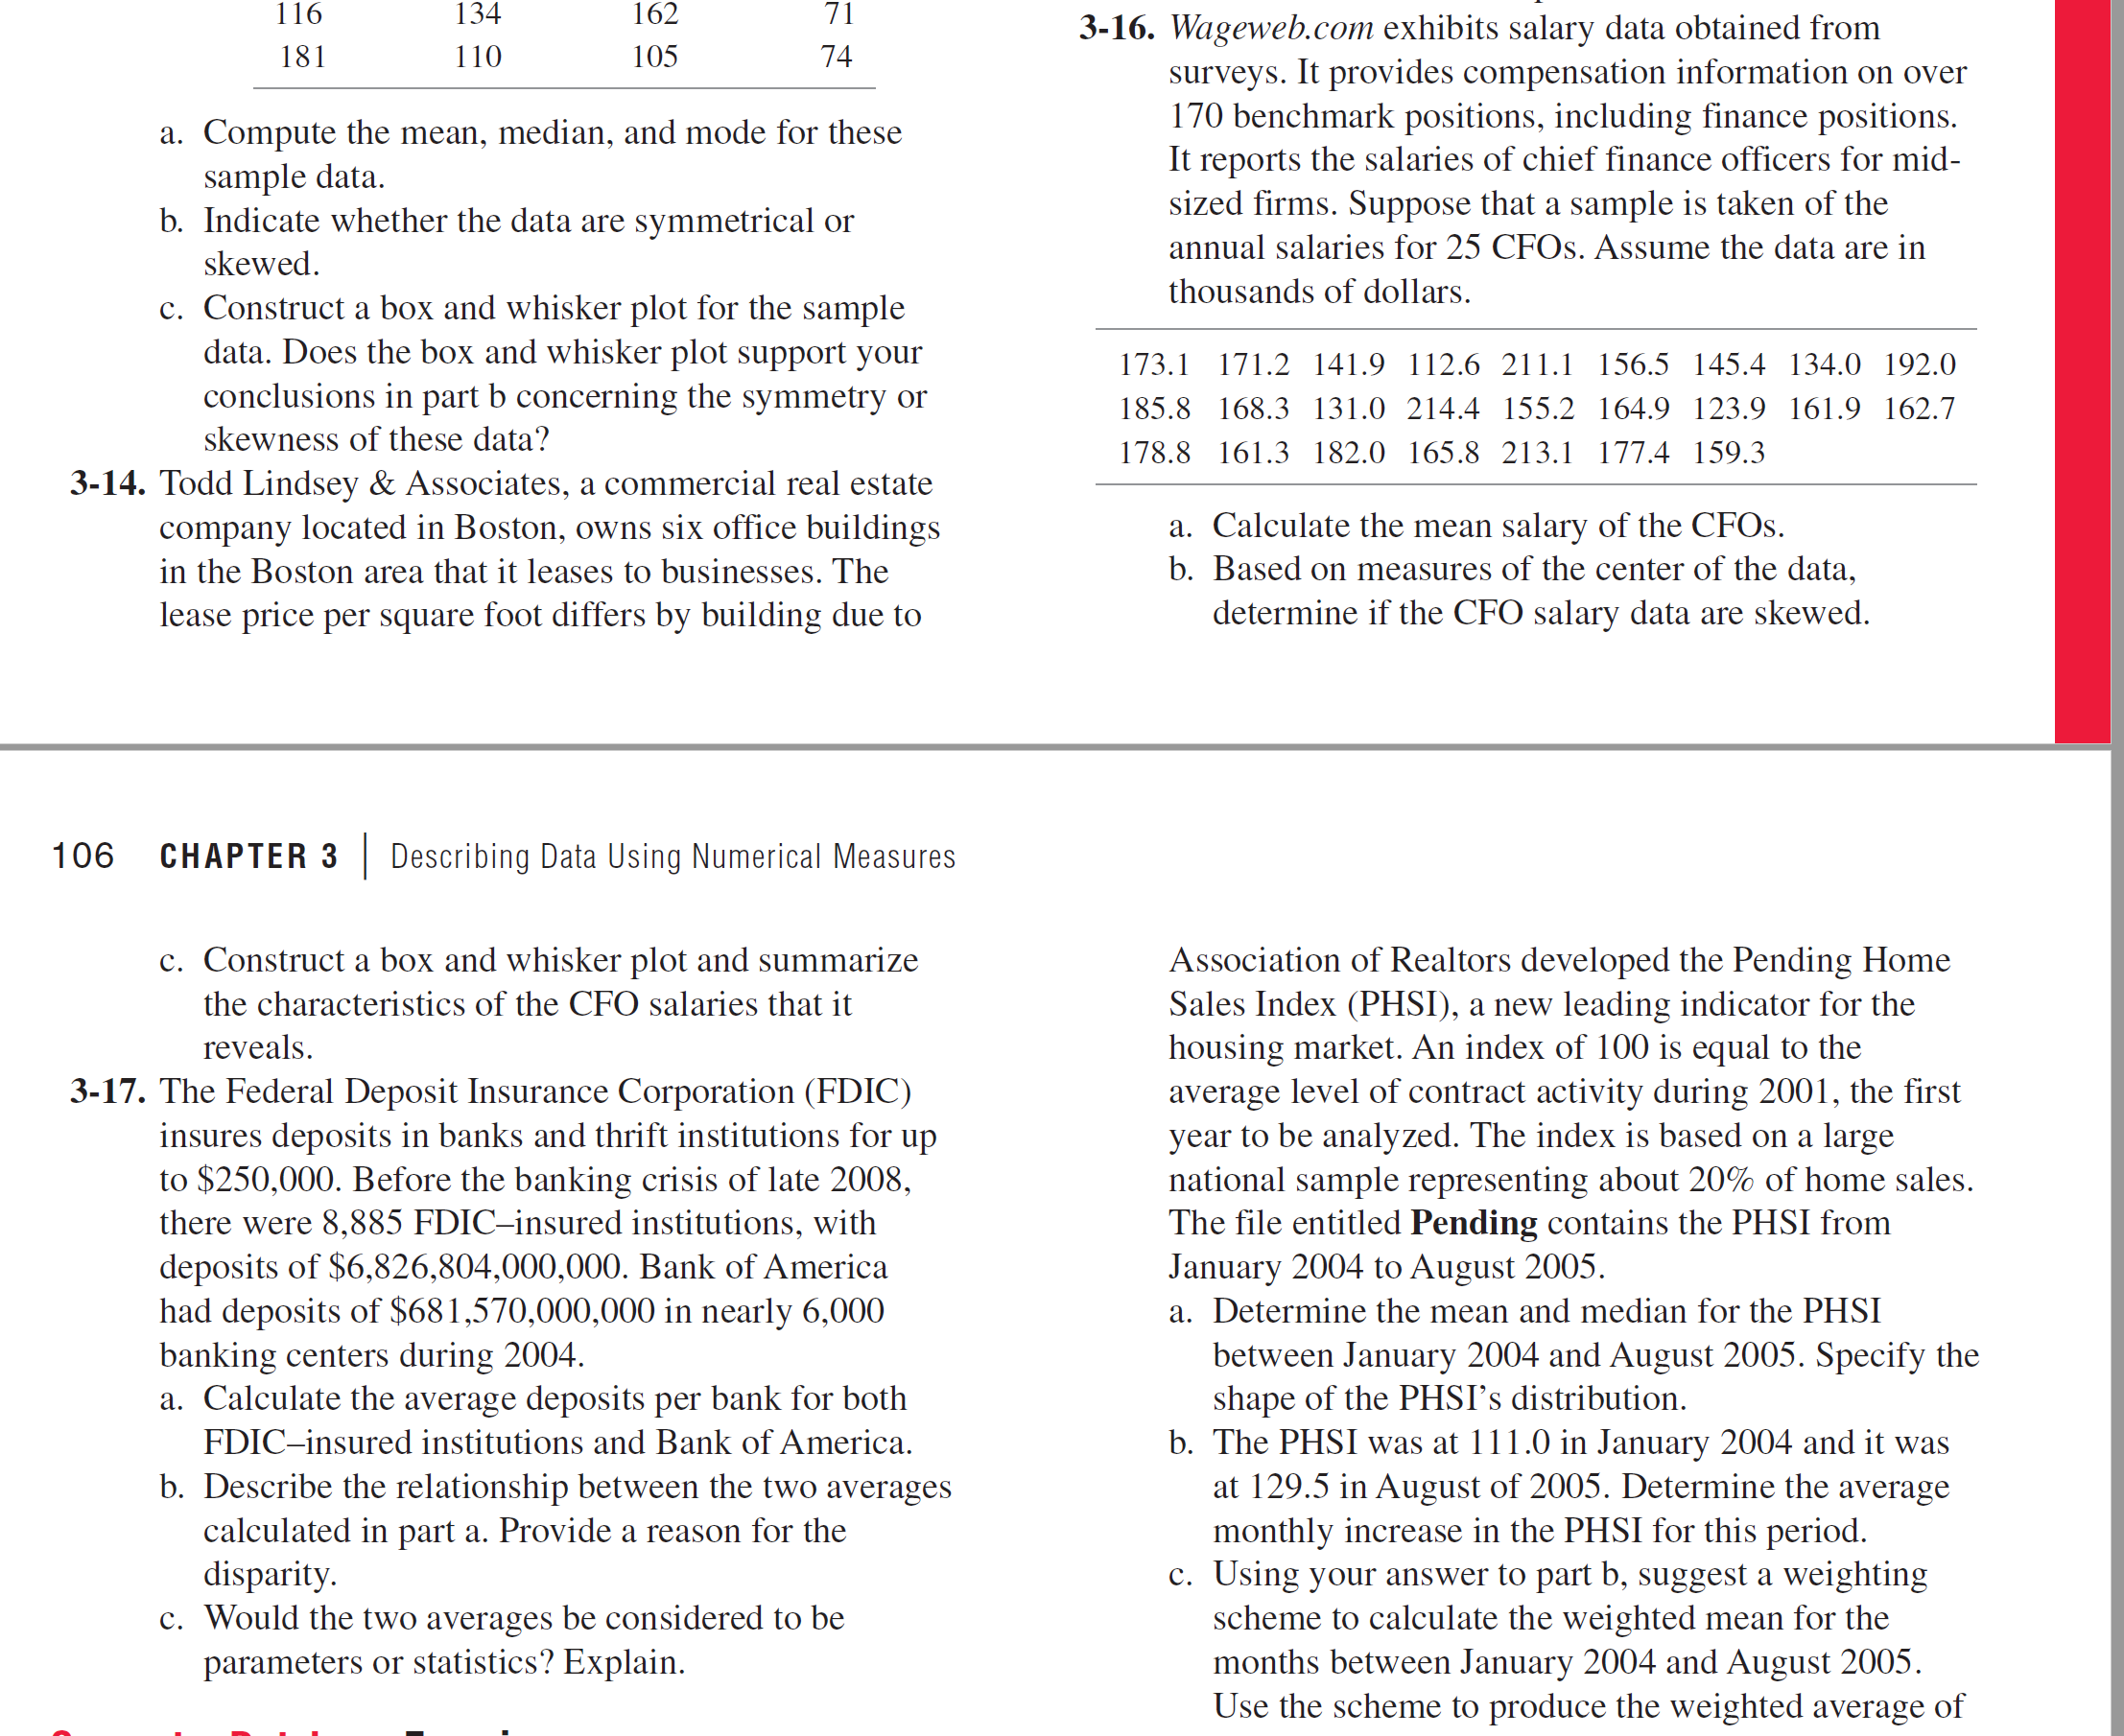
116 134 162 71 3-16. Wageweb.c0m exhibits salary data obtained from 181 110 105 74 surveys. It provides compensation information on over 170 benchmark positions, including nance positions. It reports the salaries of chief nance ofcers for mid sized rms. Suppose that a sample is taken of the annual salaries for 25 CFOs. Assume the data are in a. Compute the mean, median, and mode for these sample data. b. Indicate whether the data are symmetrical or skewed. 0. Construct a box and whisker plot for the sample thousands 0f dollars. data- D065 the box and WhiSker P10t support Your 173.1 171.2 141.9 112.6 211.1 156.5 145.4 134.0 192.0 COUCIUSiOUS in Part '9 concerning the Symmetry or 185.8 168.3 131.0 214.4 155.2 164.9 123.9 161.9 162.7 Skewness 01331656 data? 178.8 161.3 182.0 165.8 213.1 177.4 159.3 3-14. Todd Lindsey & Associates, a commercial real estate company located in Boston, owns six ofce buildings a. Calculate the mean salary of the CFOs. in the Boston area that it leases to businesses. The b. Based on measures of the center of the data, lease price per square foot differs by building due to determine if the CFO salary data are skewed. 106 CHAPTER 3 Describing Data Using Numerical Measures 0. Construct a box and whisker plot and summarize Association of Realtors developed the Pending Home the characteristics of the CFO salaries that it Sales Index (PHSI), a new leading indicator for the reveals. housing market. An index of 100 is equal to the 3-17. The Federal Deposit Insurance Corporation (FDIC) average level of contract activity during 2001, the rst insures deposits in banks and thrift institutions for up year to be analyzed. The index is based on a large to $250,000. Before the banking crisis of late 2008, national sample representing about 20% of home sales. there were 8,885 FDICinsured institutions, with The le entitled Pending contains the PHSI from deposits of $6,826,804,000,000. Bank of America January 2004 to August 2005. had deposits of $681,570,000,000 in nearly 6,000 a. Determine the mean and median for the PHSI banking centers during 2004. between January 2004 and August 2005 . Specify the a. Calculate the average deposits per bank for both shape of the PHSI's distribution. FDICinsured institutions and Bank of America. b. The PHSI was at 111.0 in January 2004 and it was b. Describe the relationship between the two averages at 129.5 in August of 2005 . Determine the average calculated in part a. Provide a reason for the monthly increase in the PHSI for this period. disparity. c. Using your answer to part b, suggest a weighting c. Would the two averages be considered to be scheme to calculate the weighted mean for the parameters or statistics? Explain. months between January 2004 and August 2005. Use the scheme to produce the weighted average of
Step by Step Solution
There are 3 Steps involved in it
Step: 1
Get Instant Access to Expert-Tailored Solutions
See step-by-step solutions with expert insights and AI powered tools for academic success
Step: 2
Step: 3
Ace Your Homework with AI
Get the answers you need in no time with our AI-driven, step-by-step assistance