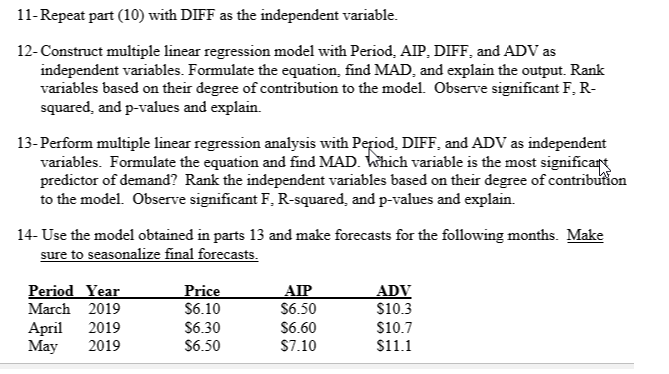
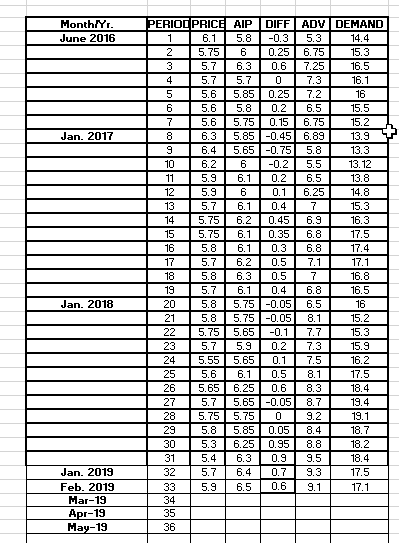
11-Repeat part (10) with DIFF as the independent variable. 12-Construct multiple linear regression model with Period, AIP, DIFF, and ADV as independent variables. Formulate the equation, find MAD, and explain the output. Rank variables based on their degree of contribution to the model. Observe significant F, R squared, and p-values and explain. 13-Perform multiple linear regression analysis with Period, DIFF, and ADV as independent variables. Formulate the equation and find MAD predictor of demand? Rank the independent variables based on their degree of o to the model. Observe significant F, R-squared, and p-values and explain. variable is the most si 14- Use the model obtained in parts 13 and make forecasts for the following months. Make sure to seasonalize final forecasts PeriodYear March 2019 April 2019 May 2019 Price S6.10 S6.30 S6.50 AIP S6.50 S6.60 S7.10 ADV S10.3 S10.7 $11.1 Month/Yr June 2016 6.15.8.35.3 5.75 5.7 6.3 0.6 7.25 5.75.7 5.6 5.850.25 7.2 5.6 5.8 0.2 6.5 5.6 5.750.156.75 4.4 15.3 16.5 16.1 7.3 15.5 15.2 Jan. 2017 13.3 13.12 13.8 14.8 15.3 16.3 17.5 10 6.2 5.9 6.1 0.2 6.5 5.9 6 0.25.5 0.1 6.25 145.756.2 0.456.9 5.75 6.1 0.356.8 5.8 6.1 0.3 6.8 5.7 6.2 0.5 7.1 16 17.1 16.8 16.5 16 15.2 15.3 5.9 16.2 17.5 18.4 9.4 5.7 6.1 0.46.8 5.8 Jan. 2018 20 23 24 5.55 5.650. 7.5 25 26 5.65 6.250.6 8.3 27 28 5.755.750 29 30 5.7 5.90.2 7.3 5.6 6.0.5 8.1 9.2 8.4 5.3 6.250.958.8 5.4 6.3 0.99.5 5.7 6.40.7 9.3 5.9 6.5 0.6 9.1 18.7 18.2 8.4 17.5 17.1 Jan. 2019 Feb. 2019 Har-19 Apr-19 May-19 32 34 35 36 11-Repeat part (10) with DIFF as the independent variable. 12-Construct multiple linear regression model with Period, AIP, DIFF, and ADV as independent variables. Formulate the equation, find MAD, and explain the output. Rank variables based on their degree of contribution to the model. Observe significant F, R squared, and p-values and explain. 13-Perform multiple linear regression analysis with Period, DIFF, and ADV as independent variables. Formulate the equation and find MAD predictor of demand? Rank the independent variables based on their degree of o to the model. Observe significant F, R-squared, and p-values and explain. variable is the most si 14- Use the model obtained in parts 13 and make forecasts for the following months. Make sure to seasonalize final forecasts PeriodYear March 2019 April 2019 May 2019 Price S6.10 S6.30 S6.50 AIP S6.50 S6.60 S7.10 ADV S10.3 S10.7 $11.1 Month/Yr June 2016 6.15.8.35.3 5.75 5.7 6.3 0.6 7.25 5.75.7 5.6 5.850.25 7.2 5.6 5.8 0.2 6.5 5.6 5.750.156.75 4.4 15.3 16.5 16.1 7.3 15.5 15.2 Jan. 2017 13.3 13.12 13.8 14.8 15.3 16.3 17.5 10 6.2 5.9 6.1 0.2 6.5 5.9 6 0.25.5 0.1 6.25 145.756.2 0.456.9 5.75 6.1 0.356.8 5.8 6.1 0.3 6.8 5.7 6.2 0.5 7.1 16 17.1 16.8 16.5 16 15.2 15.3 5.9 16.2 17.5 18.4 9.4 5.7 6.1 0.46.8 5.8 Jan. 2018 20 23 24 5.55 5.650. 7.5 25 26 5.65 6.250.6 8.3 27 28 5.755.750 29 30 5.7 5.90.2 7.3 5.6 6.0.5 8.1 9.2 8.4 5.3 6.250.958.8 5.4 6.3 0.99.5 5.7 6.40.7 9.3 5.9 6.5 0.6 9.1 18.7 18.2 8.4 17.5 17.1 Jan. 2019 Feb. 2019 Har-19 Apr-19 May-19 32 34 35 36