

Answered step by step
Verified Expert Solution
Question
1 Approved Answer
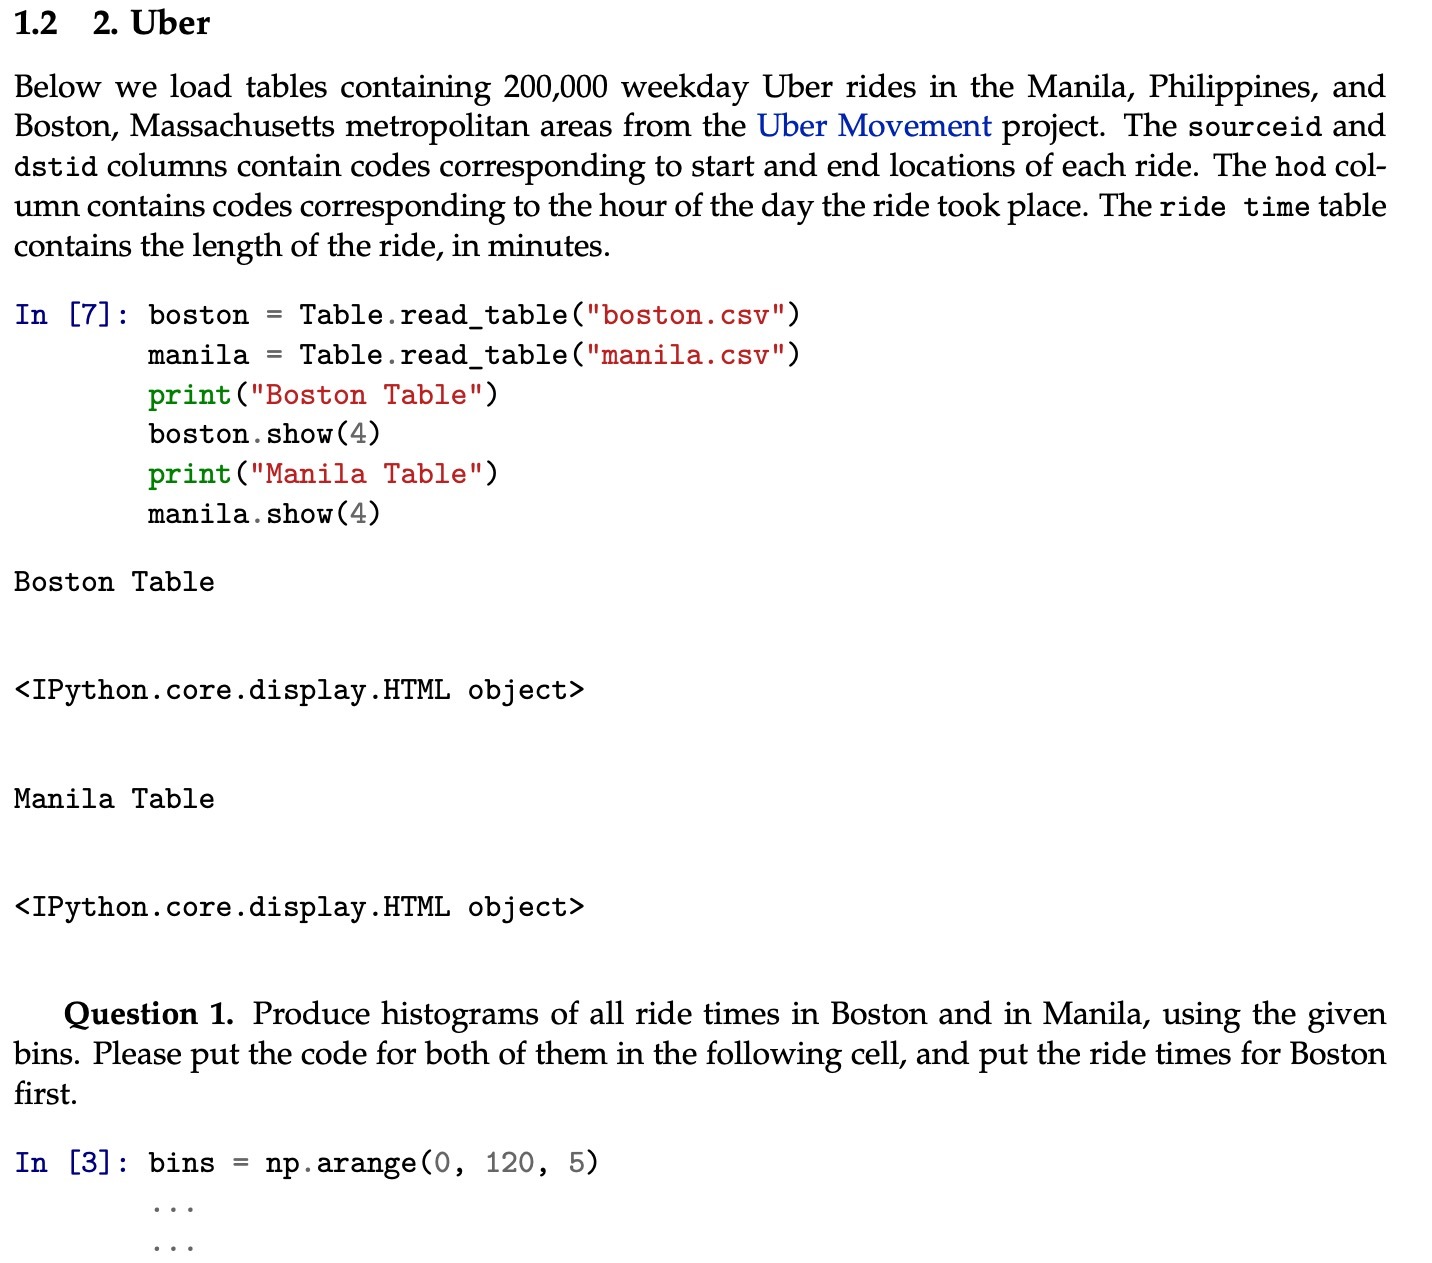
1.2 2. Uber Below we load tables containing 200,000 weekday Uber rides in the Manila, Philippines, and Boston, Massachusetts metropolitan areas from the Uber Movement
Step by Step Solution
There are 3 Steps involved in it
Step: 1

Get Instant Access to Expert-Tailored Solutions
See step-by-step solutions with expert insights and AI powered tools for academic success
Step: 2

Step: 3
Ace Your Homework with AI
Get the answers you need in no time with our AI-driven, step-by-step assistance
Get Started
Microsoft Dynamics 365 Core Finance And Operations Exams And Practice Tests Exam Study Guide For Microsoft Mb 300
Authors: Exam Library
1st Edition
979-8858858331