Answered step by step
Verified Expert Solution
Link Copied!

Question

1 Approved Answer

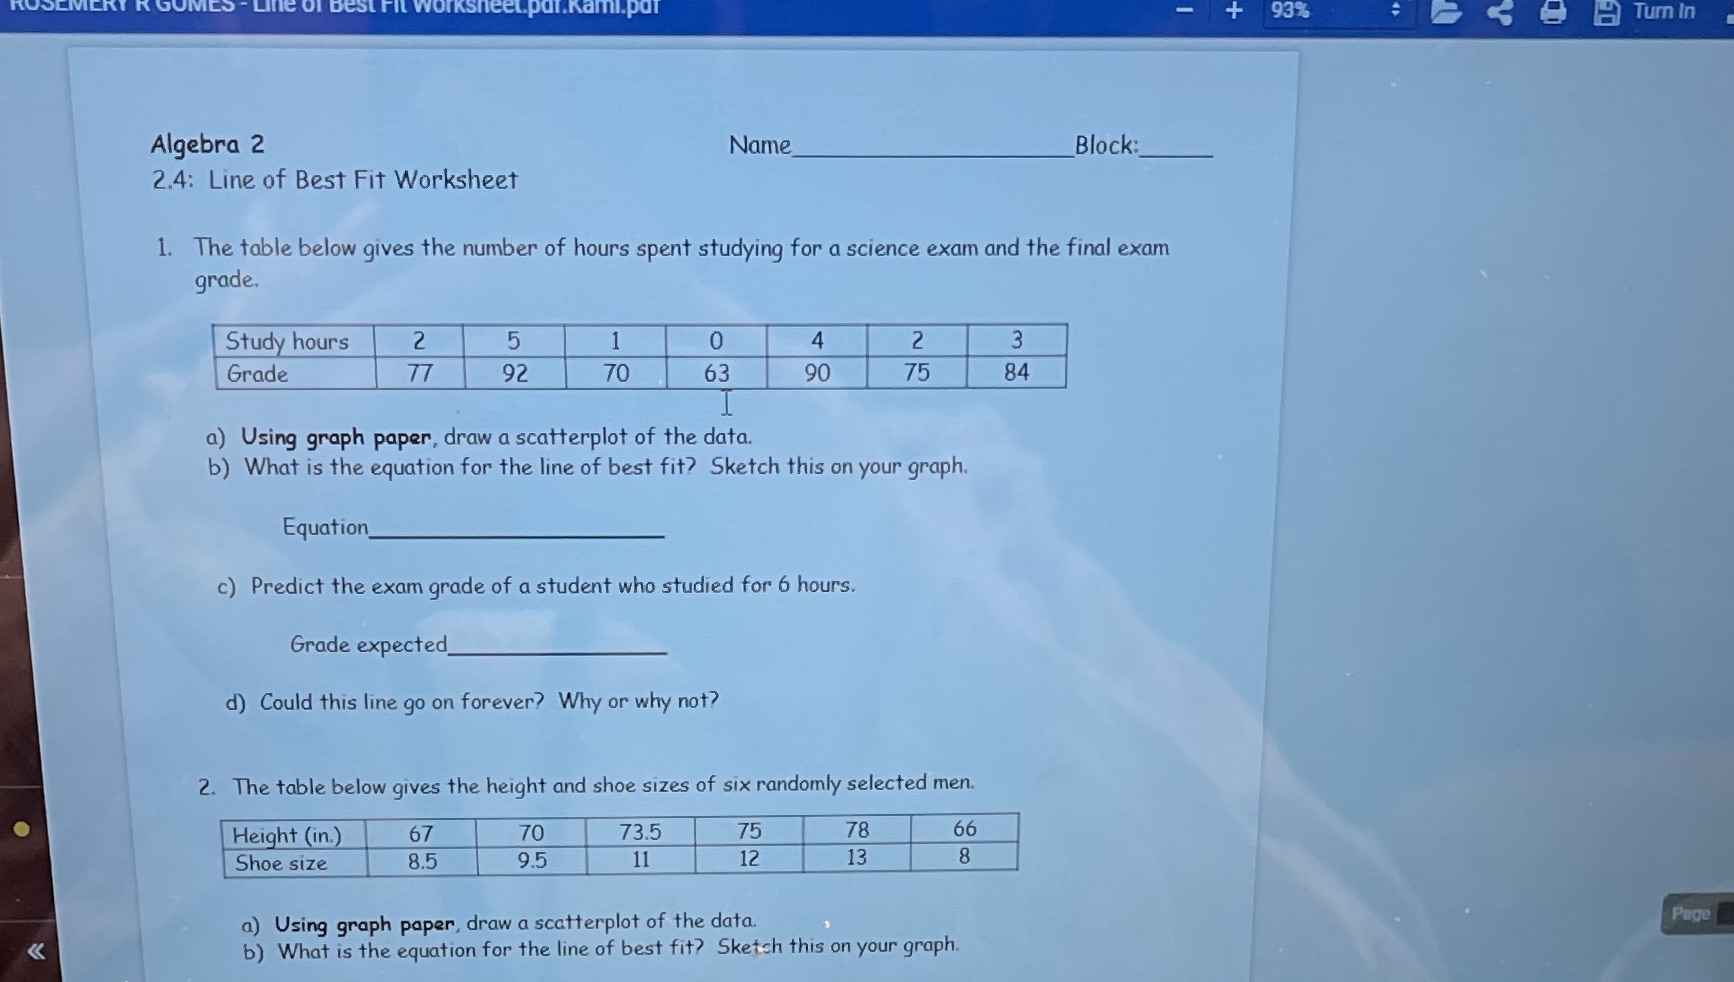
1/2 ar.Kami.par 93% Tum In Algebra 2 Name Block: 2.4: Line of Best Fit Worksheet 1. The table below gives the number of hours spent

1/2

image text in transcribed
ar.Kami.par 93% Tum In Algebra 2 Name Block: 2.4: Line of Best Fit Worksheet 1. The table below gives the number of hours spent studying for a science exam and the final exam grade. Study hours 2 5 1 0 4 2 3 Grade 77 92 70 63 90 75 84 a) Using graph paper, draw a scatterplot of the data. b) What is the equation for the line of best fit? Sketch this on your graph. Equation c) Predict the exam grade of a student who studied for 6 hours. Grade expected d) Could this line go on forever? Why or why not? 2. The table below gives the height and shoe sizes of six randomly selected men. Height (in.) 67 70 73.5 75 78 66 Shoe size 8.5 9.5 11 12 13 8 a) Using graph paper, draw a scatterplot of the data. Page

Step by Step Solution

There are 3 Steps involved in it

Step: 1

blur-text-image

Get Instant Access to Expert-Tailored Solutions

See step-by-step solutions with expert insights and AI powered tools for academic success

Step: 2

blur-text-image

Step: 3

blur-text-image

Ace Your Homework with AI

Get the answers you need in no time with our AI-driven, step-by-step assistance

Get Started

Recommended Textbook for

WebAssign For Trigonometry

Authors: James Stewart

2nd Edition

1337772313, 9781337772310

More Books

Students also viewed these Mathematics questions

Question

d. Is the program accredited?

Answered: 1 week ago

Question

3. Tactical/strategic information.

Answered: 1 week ago

Question

3. To retrieve information from memory.

Answered: 1 week ago

Question

2. Value-oriented information and

Answered: 1 week ago