

Answered step by step
Verified Expert Solution
Question
1 Approved Answer
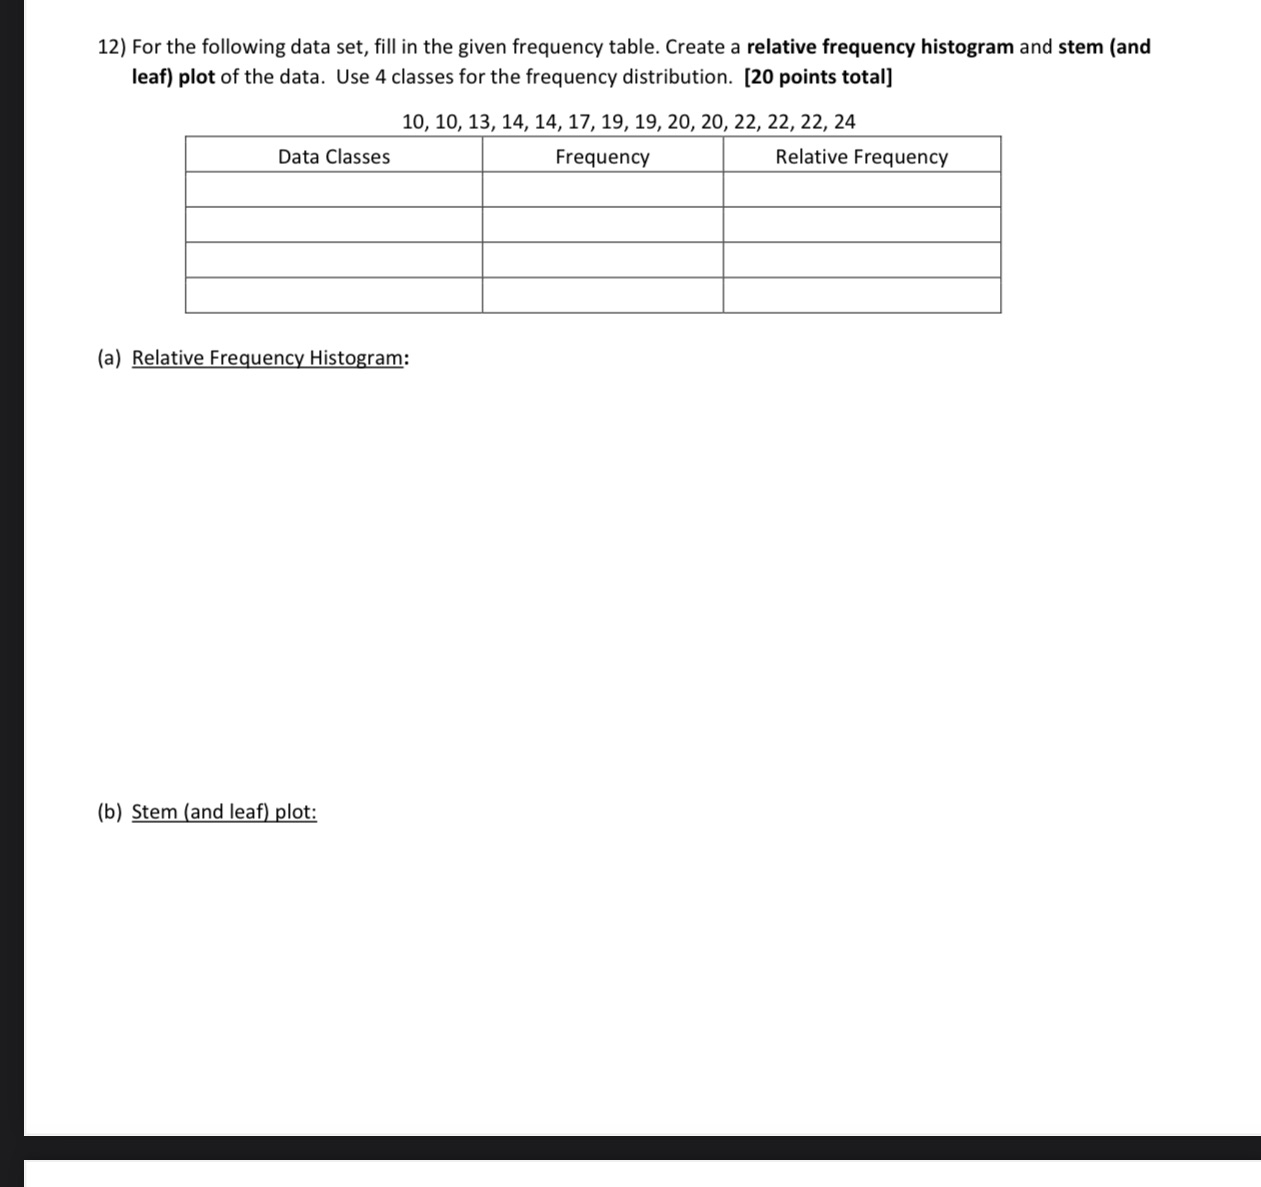
12) For the following data set, fill in the given frequency table. Create a relative frequency histogram and stem (and leaf) plot of the data.
Step by Step Solution
There are 3 Steps involved in it
Step: 1

Get Instant Access to Expert-Tailored Solutions
See step-by-step solutions with expert insights and AI powered tools for academic success
Step: 2

Step: 3
Ace Your Homework with AI
Get the answers you need in no time with our AI-driven, step-by-step assistance
Get Started
Precalculus Concepts Through Functions, A Unit Circle Approach To Trigonometry
Authors: Michael Sullivan, Michael Sullivan III
3rd Edition
0321925866, 9780321925862