1/2 I just need help with the debt to ratio % on 2021
2/2
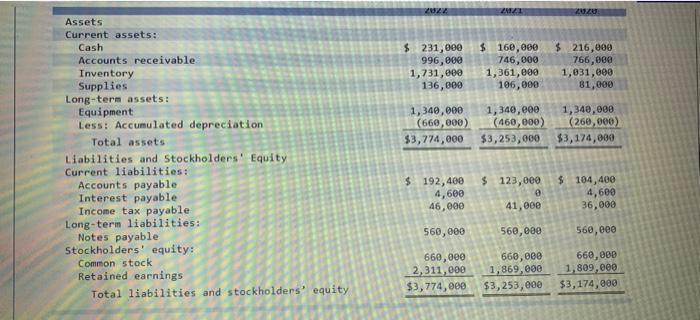
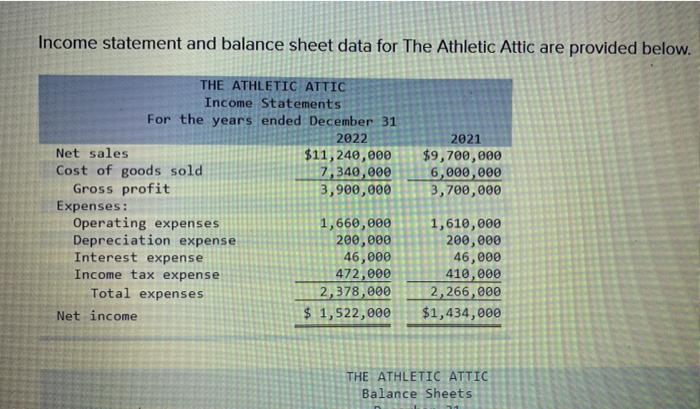
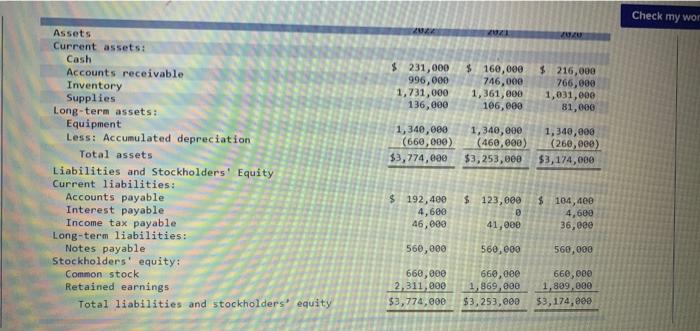
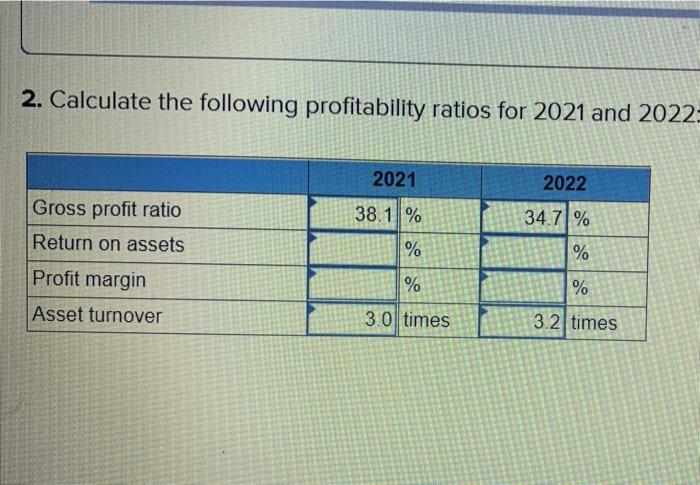
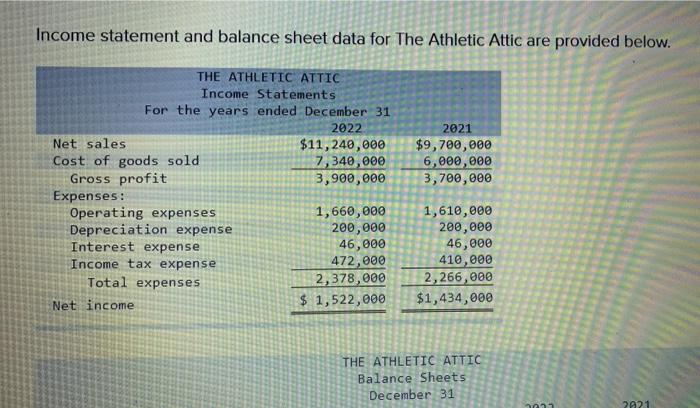
Income statement and balance sheet data for The Athletic Attic are provided below. 2021 $9,700,000 6,000,000 3,700,000 THE ATHLETIC ATTIC Income Statements For the years ended December 31 2022 Net sales $11,240,000 Cost of goods sold 7,340,000 Gross profit 3,900,000 Expenses: Operating expenses 1,660,000 Depreciation expense 200,000 Interest expense 46,000 Income tax expense 472,000 Total expenses 2,378,000 Net income $ 1,522,000 1,610,000 200,000 46,000 410,000 2,266,000 $ $1,434,000 THE ATHLETIC ATTIC Balance Sheets December 31 2021 202 2014 UZU $ 231,000 996,000 1,731,000 136,000 $ 160,000 746,000 1,361,000 106,000 $ 216,000 766,000 1,031,000 81,000 1,340,000 (660,000) $3,774,000 1,340,000 (460,000) $3,253,000 1,340,000 (260,000) $3,174,000 Assets Current assets: Cash Accounts receivable Inventory Supplies Long-term assets: Equipment Less: Accumulated depreciation Total assets Liabilities and Stockholders' Equity Current liabilities: Accounts payable Interest payable Income tax payable Long-term liabilities: Notes payable Stockholders' equity: Common stock Retained earnings Total liabilities and stockholders' equity $ 123,000 $ 192,400 4,600 46,000 $ 104,400 4,600 36,000 41,000 560,000 560,000 560,000 660,000 2,311,000 $3,774, 880 660,000 1,869,000 $3,253,000 660,000 1,809,000 $3, 174,000 Income statement and balance sheet data for The Athletic Attic are provided below. 2021 $9,700,000 6,000,000 3,700,000 THE ATHLETIC ATTIC Income Statements For the years ended December 31 2022 Net sales $11, 240,000 Cost of goods sold 7,340,000 Gross profit 3,900,000 Expenses: Operating expenses 1,660,000 Depreciation expense 200,000 Interest expense 46,000 Income tax expense 472,000 Total expenses 2, 378,000 Net income $ 1,522,000 1,610,000 200,000 46,000 410,000 2,266,000 $1,434,000 THE ATHLETIC ATTIC Balance Sheets Check my wor UZU $ 231,000 996,000 1,731,000 136,000 $ 160,000 746,000 1,361,000 106,00 $ 216,000 766,000 1,031,000 81,000 1,340,080 (660,000) $3,774,000 1,340,000 (460,000) $3,253,000 1,340,000 (260,000) $3,174,000 Assets Current assets: Cash Accounts receivable Inventory Supplies Long-term assets: Equipment Less: Accumulated depreciation Total assets Liabilities and Stockholders' Equity Current liabilities: Accounts payable Interest payable Income tax payable Long-term liabilities: Notes payable Stockholders' equity: Common stock Retained earnings Total liabilities and stockholders' equity $ 123,000 $ 192,400 4,600 46,000 $ 104,400 4,600 36,080 41,000 560,000 560,000 560,000 660,000 2,311,000 $3,774, eee 660,000 1,869,000 $3,253,000 660,000 1,899,000 53, 174,899 2. Calculate the following profitability ratios for 2021 and 2022 2021 2022 38.1 % Gross profit ratio Return on assets 34.71% % % Profit margin % % Asset turnover 3.0 times 3.2 times


