

Answered step by step
Verified Expert Solution
Question
1 Approved Answer
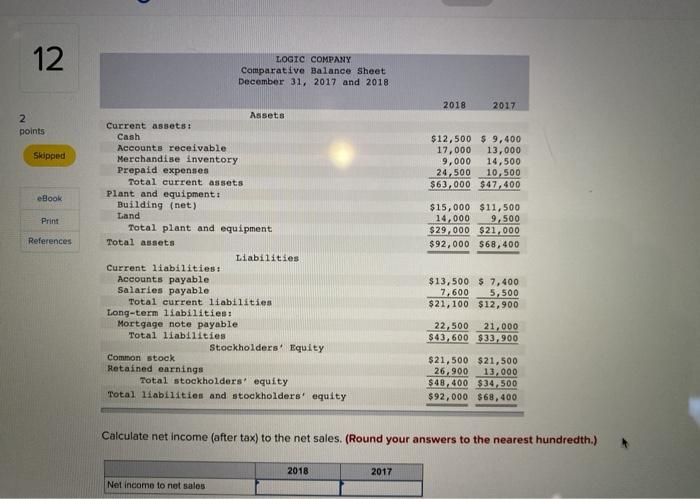
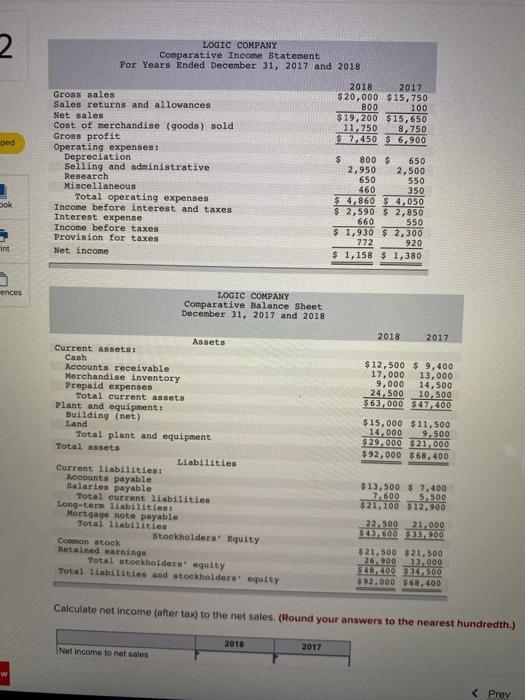
12 LOGIC COMPANY Comparative Balance Sheet December 31, 2017 and 2018 2018 2017 2 points Skipped $12,500 $ 9,400 17,000 13,000 9,000 14,500 24,500 10,500
Step by Step Solution
There are 3 Steps involved in it
Step: 1

Get Instant Access to Expert-Tailored Solutions
See step-by-step solutions with expert insights and AI powered tools for academic success
Step: 2

Step: 3
Ace Your Homework with AI
Get the answers you need in no time with our AI-driven, step-by-step assistance
Get Started
Don T Be Afraid Of Accounting Learn The Basics Of Financial Accounting And Be On Your Way To Greater Success
Authors: Brad Horton
1st Edition
1708221611, 978-1708221614