
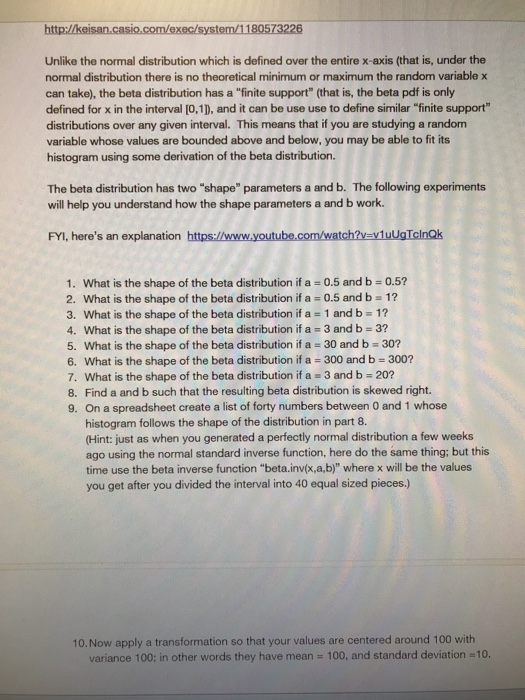
#12 Points possible: 1. Total attempts: 3 Calculate the critical z-value(s) for each of the given hypothesis test scenarios below. If multiple critical values exist for a single scenario, enter the solutions using a comma-separated list. Round z- values to two decimal places. . Find the critical z-value(s) for a left-tailed test of hypothesis for a proportion, with a sample size of 110 and let a = 0.0005. Z = . Find the critical z-value(s) for a right-tailed test of hypothesis for a proportion, with a sample size of 96 and a significance level of 0.5%. 2 = . Find the critical z-value(s) for a two-tailed test of hypothesis for a proportion, with a sample size of 84 and a significance level of 0.1%. 2 = . Find the critical z-value(s) for a two-tailed test of hypothesis for a proportion, with a sample size of 106 and a significance level of 20%.(2) Let N : [0, oo) - Z be (the counting function associated to) a Poisson process of intensity A and fix o E (0, co). Show that t - N(at) is a Poisson process and determine its intensity. Hint: Remember that a Poisson process is the unique process with its marginal distributions.5. Poisson processes (a) Give the probability that there are exactly 3 arrivals in a time interval of length 2 for a Poisson process of intensity A. (b) Give the expected inter-arrival time for a Poisson process of intensity 5. (c) Explain what it means that increments are stationary for a Poisson process.http://keisan.casio.com/exec/system/1180573226 Unlike the normal distribution which is defined over the entire x-axis (that is, under the normal distribution there is no theoretical minimum or maximum the random variable x can take), the beta distribution has a "finite support" (that is, the beta pdf is only defined for x in the interval [0,1]), and it can be use use to define similar "finite support" distributions over any given interval. This means that if you are studying a random variable whose values are bounded above and below, you may be able to fit its histogram using some derivation of the beta distribution. The beta distribution has two "shape" parameters a and b. The following experiments will help you understand how the shape parameters a and b work. FYI, here's an explanation https://www.youtube.com/watch?v=v1uUgTelnQk 1. What is the shape of the beta distribution if a = 0.5 and b = 0.5? 2. What is the shape of the beta distribution if a = 0.5 and b = 1? 3. What is the shape of the beta distribution if a = 1 and b = 1? 4. What is the shape of the beta distribution if a = 3 and b = 3? 5. What is the shape of the beta distribution if a = 30 and b = 30? 6. What is the shape of the beta distribution if a = 300 and b = 300? 7. What is the shape of the beta distribution if a = 3 and b = 20? 8. Find a and b such that the resulting beta distribution is skewed right. 9. On a spreadsheet create a list of forty numbers between 0 and 1 whose histogram follows the shape of the distribution in part 8. (Hint: just as when you generated a perfectly normal distribution a few weeks ago using the normal standard inverse function, here do the same thing; but this time use the beta inverse function "beta.inv(x,a,b)" where x will be the values you get after you divided the interval into 40 equal sized pieces.) 10. Now apply a transformation so that your values are centered around 100 with variance 100; in other words they have mean = 100, and standard deviation =10


