

Answered step by step
Verified Expert Solution
Question
1 Approved Answer
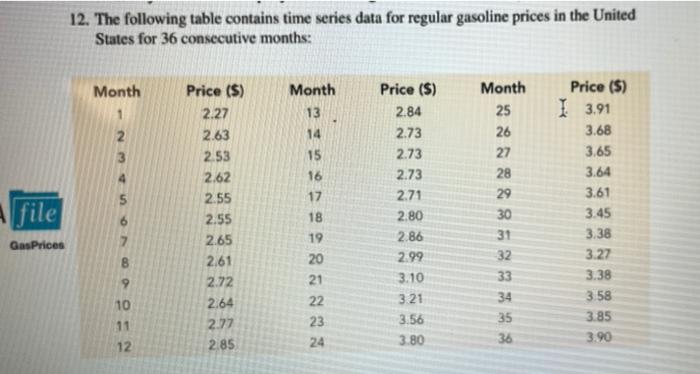
12. The following table contains time series data for regular gasoline prices in the United States for 36 consecutive months: Month 2 3 5 file
Step by Step Solution
There are 3 Steps involved in it
Step: 1

Get Instant Access to Expert-Tailored Solutions
See step-by-step solutions with expert insights and AI powered tools for academic success
Step: 2

Step: 3
Ace Your Homework with AI
Get the answers you need in no time with our AI-driven, step-by-step assistance
Get Started
Accounting What the Numbers Mean
Authors: David H. Marshall, Wayne W. McManus, Daniel F. Viele
10th edition
9780077515904, 007802529X, 77515900, 978-0078025297