Answered step by step
Verified Expert Solution
Question
1 Approved Answer
What is Routers optimal capital structure? Is the same debt ratio optimal regardless of whether the firm chooses operating Plan L or H? Does this
What is Router’s optimal capital structure? Is the same debt ratio optimal regardless of whether the firm chooses operating Plan L or H? Does this optimal D/V ratio minimize risk as measured by either the coefficient of variation of ROE or the times interest earned ratio? Does it maximize the firm’s earnings per share? If not, then what is “optimal” about the optimal D/V ratio?


 What
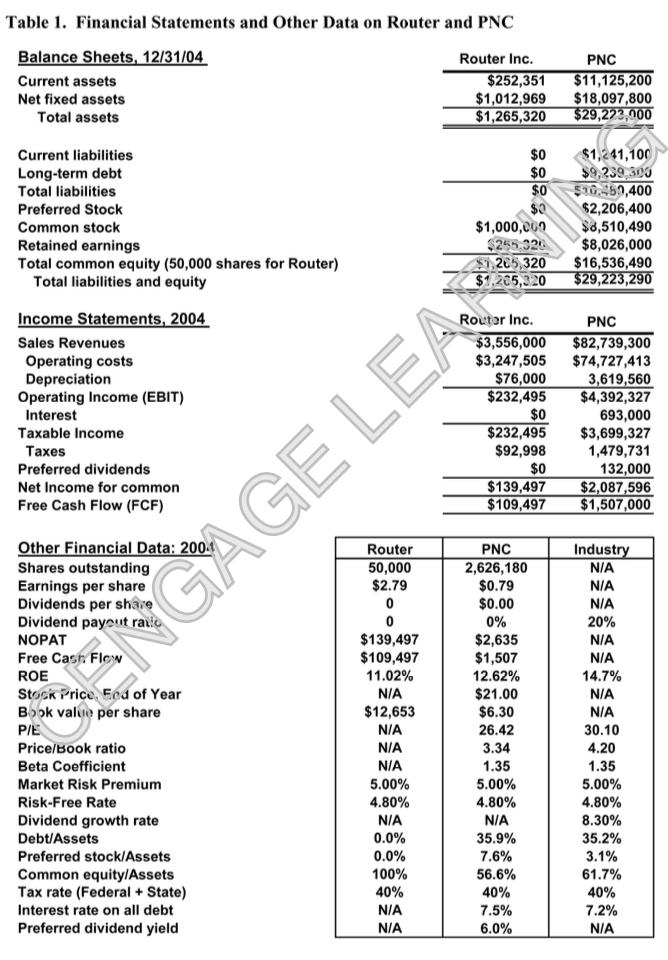
What Table 1. Financial Statements and Other Data on Router and PNC Balance Sheets, 12/31/04 Router Inc. PNC $11,125,200 Current assets Net fixed assets Total assets $252,351 $1,012,969 $1,265,320 $18,097,800 $29,223,000 Current liabilities $1,241,100 $9,239 303 a0.50,400 $2,206,400 $8,510,490 $8,026,000 Long-term debt Total liabilities $0 $0 $1,000,000 $255.320 $,205,320 $1.205,320 Preferred Stock Common stock Retained earnings Total common equity (50,000 shares for Router) Total liabilities and equity $16,536,490 $29,223,290 Income Statements, 2004 Routar Inc. PNC $3,556,000 $3,247,505 $76,000 $232,495 $0 $232,495 $92,998 $0 $139,497 $109,497 $82,739,300 $74,727,413 Sales Revenues Operating costs Depreciation Operating Income (EBIT) Interest 3,619,560 $4,392,327 693,000 $3,699,327 1,479,731 132,000 $2,087,596 $1,507,000 Taxable Income Taxes Preferred dividends Net Income for common Free Cash Flow (FCF) Other Financial Data: 200. Router 50,000 $2.79 PNC Industry N/A Shares outstanding Earnings per share Dividends per share Dividend payeut raiio 2,626,180 $0.79 $0.00 N/A N/A 20% 0% $2,635 $1,507 12.62% $21.00 $6.30 $139,497 $109,497 NOPAT N/A Free Casr. Flew NIA ROE 11.02% 14.7% Stock Price Eed of Year Book value per share N/A N/A $12,653 N/A PIE N/A 26.42 30.10 Price/Book ratio N/A 3.34 4.20 Beta Coefficient N/A 5.00% 4.80% 1.35 5.00% 4.80% 1.35 5.00% 4.80% Market Risk Premium Risk-Free Rate Dividend growth rate N/A N/A 8.30% Debt/Assets 0.0% 35.9% 35.2% 0.0% 7.6% 56.6% 3.1% 61.7% 40% 7.2% N/A Preferred stock/Assets Common equity/Assets Tax rate (Federal + State) Interest rate on all debt 100% 40% 40% NIA 7.5% Preferred dividend yield N/A 6.0% GAGE LEA
Step by Step Solution
★★★★★
3.43 Rating (159 Votes )
There are 3 Steps involved in it
Step: 1
Given Rf 480 Rm 5 WE WD H Rel ReH RD WACCL WACCH 10000 9000 0 11 13 103 11...
Get Instant Access to Expert-Tailored Solutions
See step-by-step solutions with expert insights and AI powered tools for academic success
Step: 2

Step: 3

Document Format ( 2 attachments)
635d63ace3042_175146.pdf
180 KBs PDF File
635d63ace3042_175146.docx
120 KBs Word File
Ace Your Homework with AI
Get the answers you need in no time with our AI-driven, step-by-step assistance
Get Started


