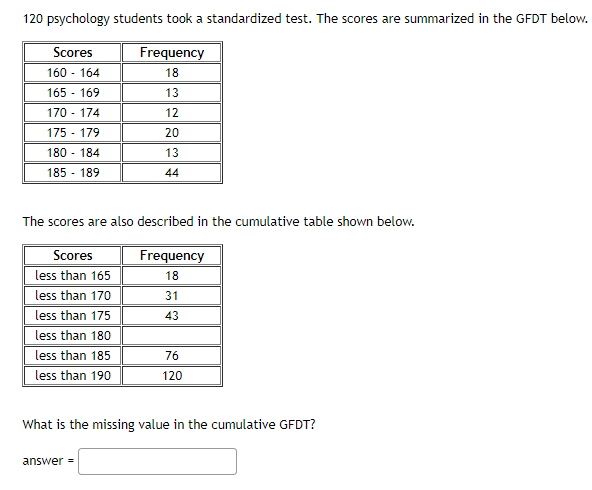
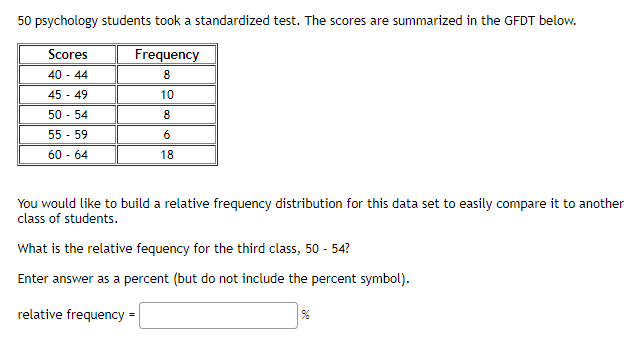
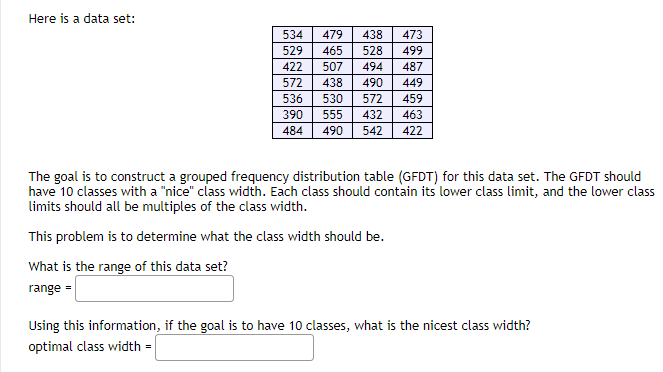
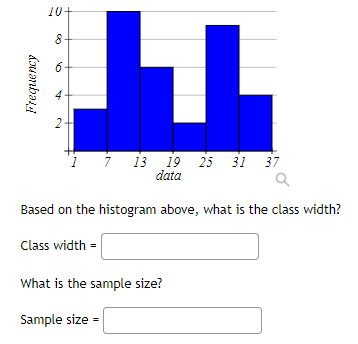
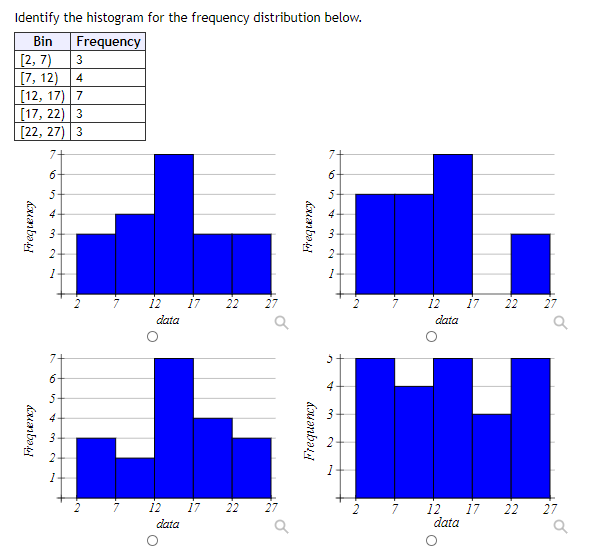
120 psychology students took a standardized test. The scores are summarized in the GFDT below. Scores Frequency 160 - 164 18 165 - 169 13 170 - 174 12 175 - 179 20 180 - 184 13 185 - 189 44 The scores are also described in the cumulative table shown below. Scores Frequency less than 165 18 less than 170 31 less than 175 43 less than 180 less than 185 76 less than 190 120 What is the missing value in the cumulative GFDT? answer =50 psychology students took a standardized test. The scores are summarized in the GFDT below. Scores Frequency 40 - 44 8 45 - 49 10 50 - 54 8 55 - 59 6 60 - 64 18 You would like to build a relative frequency distribution for this data set to easily compare it to another class of students. What is the relative fequency for the third class, 50 - 54? Enter answer as a percent (but do not include the percent symbol). relative frequency =Here is a data set: 534 479 438 473 529 465 528 499 422 507 494 487 572 438 490 449 536 530 572 459 390 555 432 463 484 490 542 422 The goal is to construct a grouped frequency distribution table (GFDT) for this data set. The GFDT should have 10 classes with a "nice" class width. Each class should contain its lower class limit, and the lower class limits should all be multiples of the class width. This problem is to determine what the class width should be. What is the range of this data set? range = Using this information, if the goal is to have 10 classes, what is the nicest class width? optimal class width =Frequency 4 7 13 19 25 31 37 data a Based on the histogram above, what is the class width? Class width = What is the sample size? Sample size =Identify the histogram for the frequency distribution below. Bin Frequency [2, 7) 3 [7, 12) [12, 17) [17, 22) 3 [22, 27) 3 Frequency Frequency 12 17 22 12 17 22 27 data Q data Q O O 4 Frequency 2 12 17 22 2 7 12 17 22 27 data data Q O O