Answered step by step
Verified Expert Solution
Question
1 Approved Answer
12.13 [32 points total] Loss functions in drug approval. Suppose there is a test, with a test score indexed by x, that yields these

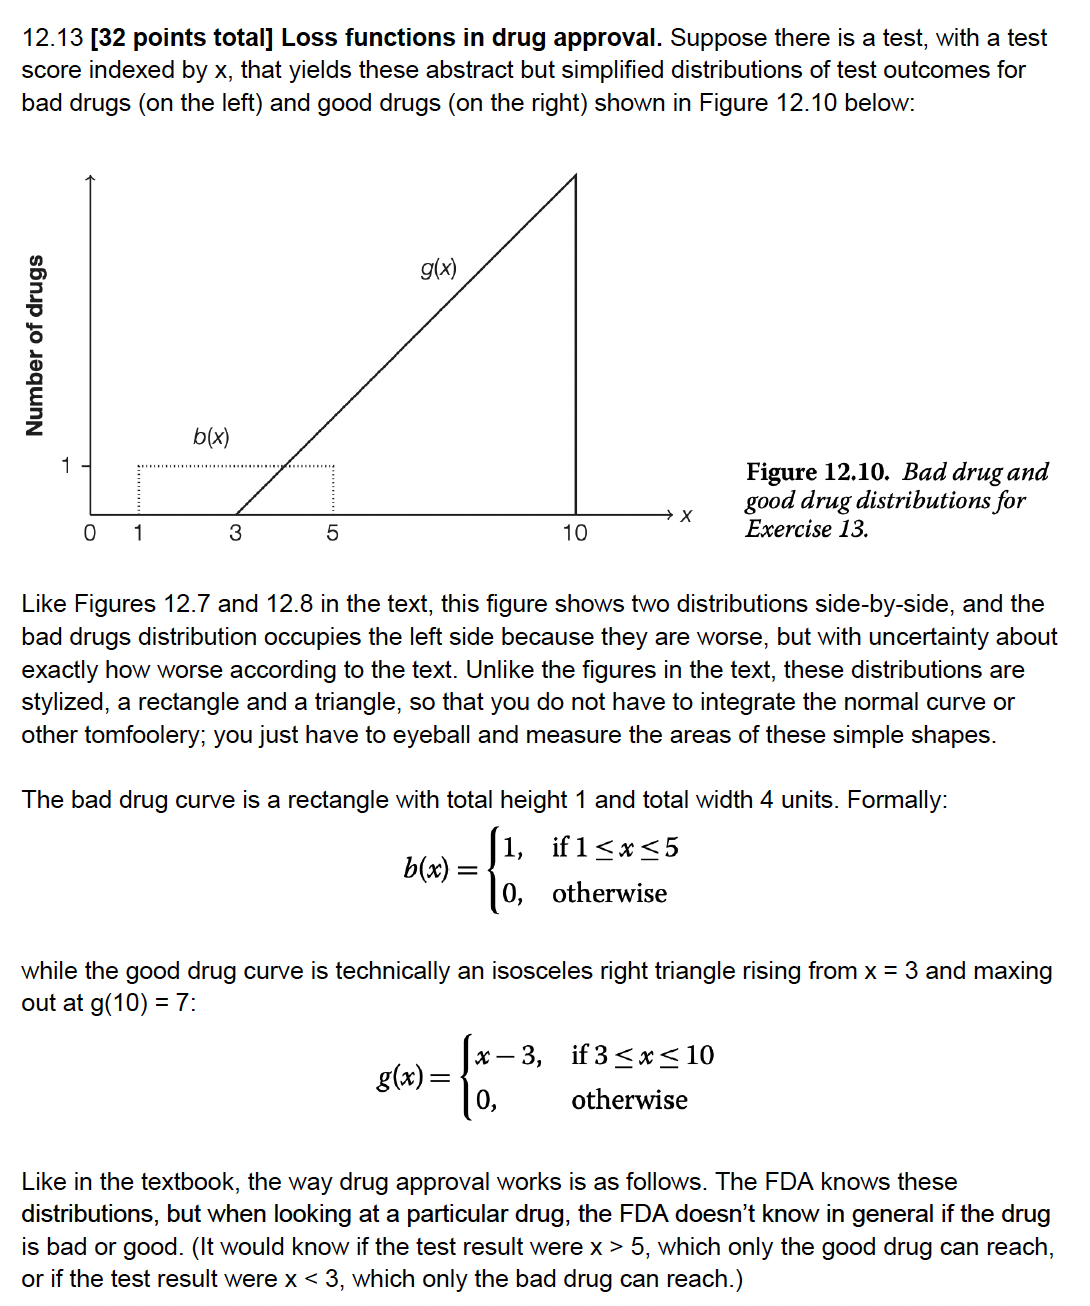
12.13 [32 points total] Loss functions in drug approval. Suppose there is a test, with a test score indexed by x, that yields these abstract but simplified distributions of test outcomes for bad drugs (on the left) and good drugs (on the right) shown in Figure 12.10 below: Number of drugs 1 0 1 b(x) 3 5 g(x) b(x) = 10 Like Figures 12.7 and 12.8 in the text, this figure shows two distributions side-by-side, and the bad drugs distribution occupies the left side because they are worse, but with uncertainty about exactly how worse according to the text. Unlike the figures in the text, these distributions are stylized, a rectangle and a triangle, so that you do not have to integrate the normal curve or other tomfoolery; you just have to eyeball and measure the areas of these simple shapes. X The bad drug curve is a rectangle with total height 1 and total width 4 units. Formally: 1, if 1 x5 0, otherwise = g(x) = Figure 12.10. Bad drug and good drug distributions for Exercise 13. while the good drug curve is technically an isosceles right triangle rising from x = 3 and maxing out at g(10) = 7: x-3, if 3 x 10 otherwise Like in the textbook, the way drug approval works is as follows. The FDA knows these distributions, but when looking at a particular drug, the FDA doesn't know in general if the drug is bad or good. (It would know if the test result were x > 5, which only the good drug can reach, or if the test result were x
Step by Step Solution
There are 3 Steps involved in it
Step: 1
To determine the drugs classification bad or good the FDA uses a threshold test score denoted as c If the test score is below c the drug is classified ...
Get Instant Access to Expert-Tailored Solutions
See step-by-step solutions with expert insights and AI powered tools for academic success
Step: 2

Step: 3

Ace Your Homework with AI
Get the answers you need in no time with our AI-driven, step-by-step assistance
Get Started


