

Answered step by step
Verified Expert Solution
Question
1 Approved Answer
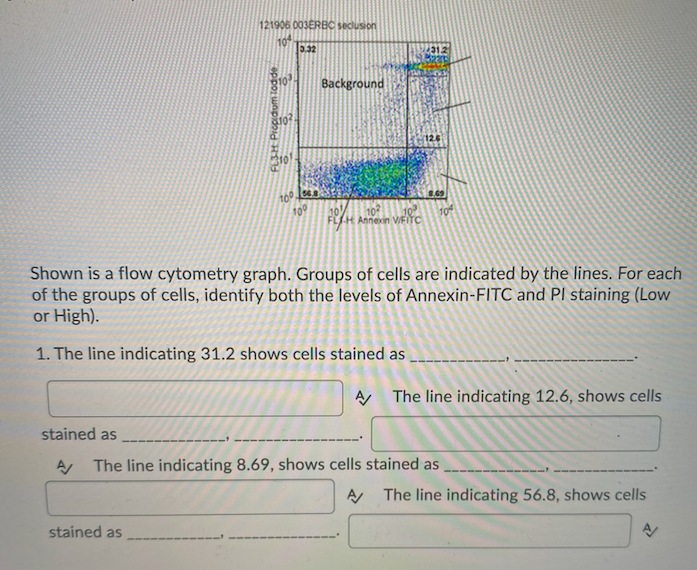
121906 003ERBC sedlusion 101 5.32 Background FLJM Progidum lodde 8.69 10 too 102 10 10 102 FL Annexin FITC Shown is a flow cytometry graph.
Step by Step Solution
There are 3 Steps involved in it
Step: 1

Get Instant Access to Expert-Tailored Solutions
See step-by-step solutions with expert insights and AI powered tools for academic success
Step: 2

Step: 3
Ace Your Homework with AI
Get the answers you need in no time with our AI-driven, step-by-step assistance
Get Started
Thermodynamics Fundamentals And Engineering Applications
Authors: William C. Reynolds, Piero Colonna
1st Edition
0521862736, 9780521862738