12.2
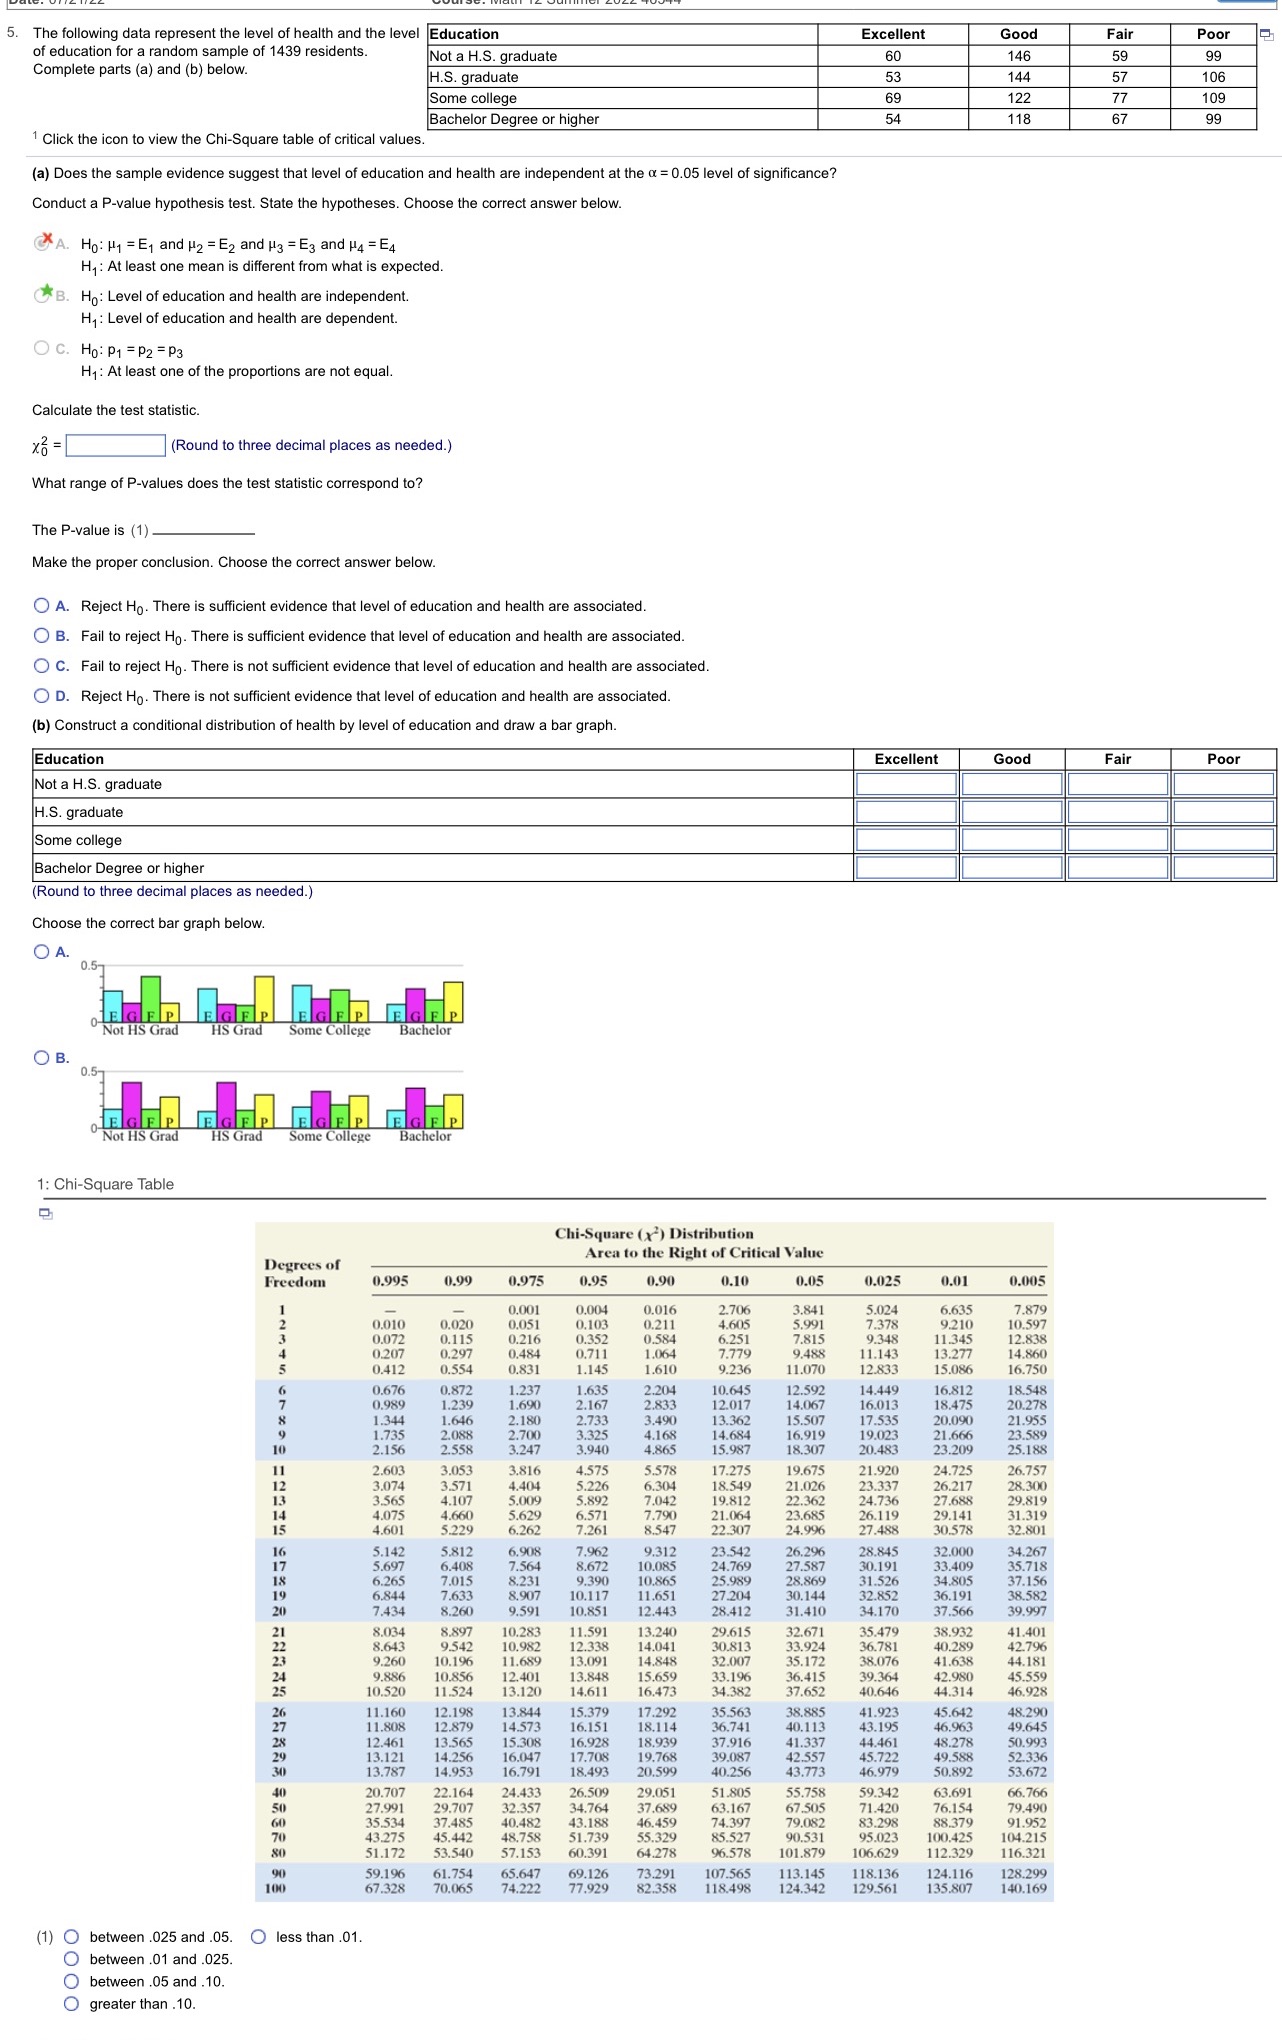
The following data represent the level of health and the level Education Excellent Good Fair Poor 59 of education for a random sample of 1439 residents. Not a H.S. graduate 60 146 99 Complete parts (a) and (b) below. 53 144 57 H.S. graduate 106 122 77 109 Some college 69 54 67 99 Bachelor Degree or higher 118 Click the icon to view the Chi-Square table of critical values. (a) Does the sample evidence suggest that level of education and health are independent at the o = 0.05 level of significance? Conduct a P-value hypothesis test. State the hypotheses. Choose the correct answer below. XA. Ho: H1 = E1 and H2 = E2 and H3 = E3 and H4 = E4 Hy: At least one mean is different from what is expected. B. Ho: Level of education and health are independent. Hy: Level of education and health are dependent. O C. Ho: P1 = P2 = P3 Hy: At least one of the proportions are not equal. Calculate the test statistic x2 : (Round to three decimal places as needed.) What range of P-values does the test statistic correspond to? The P-value is (1) - Make the proper conclusion. Choose the correct answer below. O A. Reject Ho. There is sufficient evidence that level of education and health are associated. O B. Fail to reject Ho. There is sufficient evidence that level of education and health are associated. O C. Fail to reject Ho. There is not sufficient evidence that level of education and health are associated. O D. Reject Ho. There is not sufficient evidence that level of education and health are associated. (b) Construct a conditional distribution of health by level of education and draw a bar graph. Excellent Good Fair Poor Education Not a H.S. graduate H.S. graduat Some college |Bachelor Degree or higher Round to three decimal places as needed. Choose the correct bar graph below. O A. 0.57 EGFP EGFP Not HS Grad HS Grad Some College Bachelor OB. 0.57 EG FP BGFP EGEP Not HS Grad HS Grad Some College Bachelor 1: Chi-Square Table Chi-Square (x') Distribution Area to the Right of Critical Value Degrees of ).995 0.99 0.975 0.95 0.10 0.05 0.025 0.01 0.005 Freedom 0.90 0.001 0.004 0.016 2.706 3.841 5.024 6.635 7.879 5.991 10.597 0.010 0.020 0 051 0.103 4.605 7.378 9.210 0.072 0.115 0.216 0.352 0.584 6.251 11.345 12.838 ).297 0.711 1.064 7.779 13.277 14.860 0.207 0.484 9.48 11.143 0.412 0.554 0.831 1.145 1.610 9.236 11.070 12.833 15.086 16.750 0.676 1.237 1.635 2.204 10.645 2.592 14.449 16.812 18.548 0.872 2.167 2.833 12.017 14.067 16.013 18 475 20.278 0.989 1.690 21.955 1.344 1.646 2.180 2.733 3.490 13.362 15.507 17.535 20.090 21.66 23.589 1.73 2.088 2.700 3.325 4.168 14.684 16.919 19.023 2.156 2.558 3.247 3.940 4.865 15.987 18.307 20.483 23.209 25.18 2.603 3.053 3.816 4.575 5.578 17.275 19.675 21.920 24.725 26.757 5.226 1.026 23.337 26.217 3.074 3.571 4.404 18.549 28.300 3.565 4.107 5.009 5.892 7.042 19.812 22.362 24.736 27.68 29.819 5.629 6.571 7.790 21.064 23.685 26.119 29.141 31.319 4.075 4.660 4.601 5.229 6.262 7.261 8.547 22.307 24.996 27.488 30.578 32.801 5.142 5.812 5.908 7.962 9.312 23.542 26.296 28.845 32.000 34.267 5.697 6.408 7 564 8.672 10.085 24.769 27.587 30.191 33.409 35.718 34.805 37.156 6.265 7.015 8.231 9.390 10.865 25.989 28.869 31.526 38.582 6.844 7.633 8,907 10.11 11.651 27.204 30.144 32.852 36.191 7.434 8.260 9 591 10.85 12.443 28.412 31.410 34.170 37.566 39.997 38.932 41.401 8.034 8.897 10.283 11.59 13.240 29.615 32.671 35.479 8.643 9.542 10.982 12.338 14.041 0.813 33.924 36.781 40.289 42.796 9.260 10.19 11.689 13.091 14.848 32.007 35.172 38.076 41.638 44.181 9.88 10.85 12.40 13.84 15.659 33.196 36.415 39.364 42.980 45.55 10.520 11.524 13.120 14.61 16.473 34.382 37.652 40.646 44.314 46.928 45.642 48.290 11.160 12.198 13.84 15.379 17.292 35.563 38.885 41.923 11.808 12.879 14.573 16.151 18.114 36.741 40.113 43.195 46.963 49.645 12.461 13.565 15.308 16.928 18.939 37.916 41.337 44.461 48.278 50.993 $2.336 13.12 14.250 16.04 17.70 19.768 39.087 42.557 45.722 49.58 30 50.892 13.787 14.953 16.791 18.493 20.599 40.256 43.773 46.979 53.672 40 20.707 22.164 24.433 26.509 29.051 51.805 55.758 59.342 63.691 66.766 27.991 29.70' 32.357 34.764 37.689 63.167 67.50 71.420 76.154 79.490 35.534 37.485 40.482 43.18 46.459 74.397 79.082 83.298 88.379 91.952 43.275 45.442 48.758 51.739 55.329 85.527 90.531 95.023 100.425 104.215 51.172 53.540 57.153 60.391 64.278 96.578 101.879 106.629 112.329 116.321 90 28.299 59.196 61.75 65.647 69.126 73.291 107.565 113.145 18.136 124.116 100 67.328 70.065 74.222 77.929 82.358 118.498 124.342 129.561 135.807 140.169 (1) O between .025 and .05. O less than .01. between .01 and .025. O between .05 and . 10. O greater than . 10