

Answered step by step
Verified Expert Solution
Question
1 Approved Answer
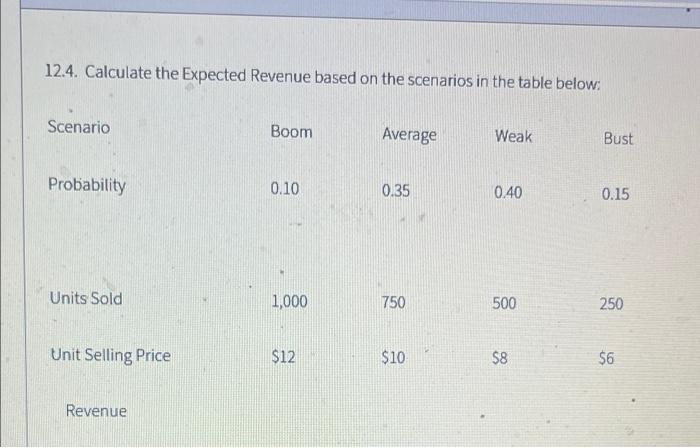
12.4. Calculate the Expected Revenue based on the scenarios in the table below: Scenario Boom Average Weak Bust Probability 0.10 0.35 0.40 0.15 Units Sold
Step by Step Solution
There are 3 Steps involved in it
Step: 1

Get Instant Access to Expert-Tailored Solutions
See step-by-step solutions with expert insights and AI powered tools for academic success
Step: 2

Step: 3
Ace Your Homework with AI
Get the answers you need in no time with our AI-driven, step-by-step assistance
Get Started
Beat The Market Win With Proven Stock Selection And Market Timing Tools
Authors: Gerald Appel
1st Edition
0132359170,0137154526