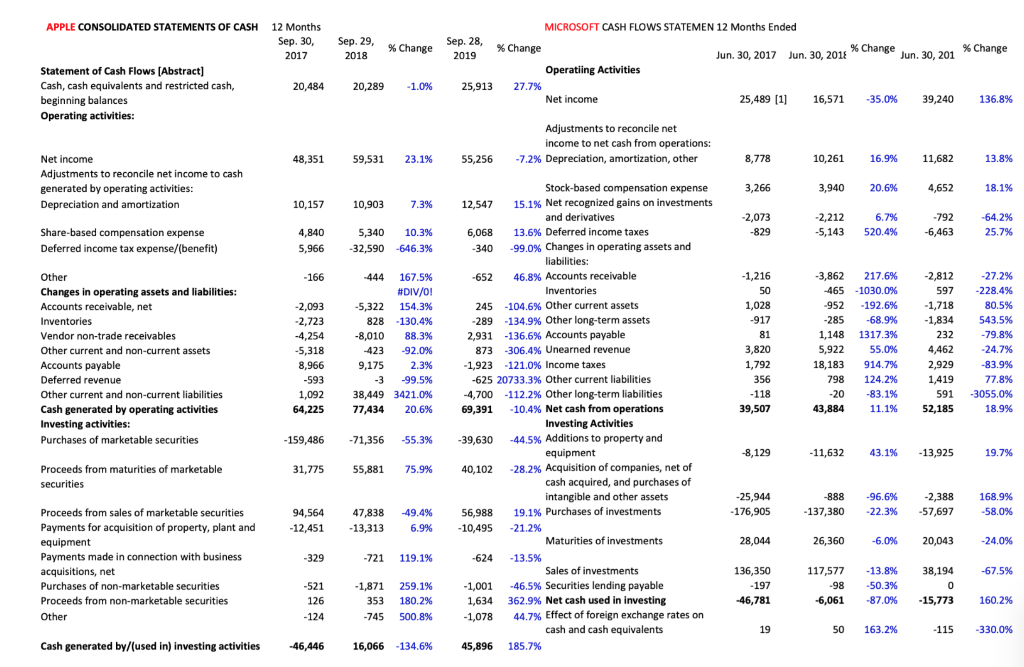
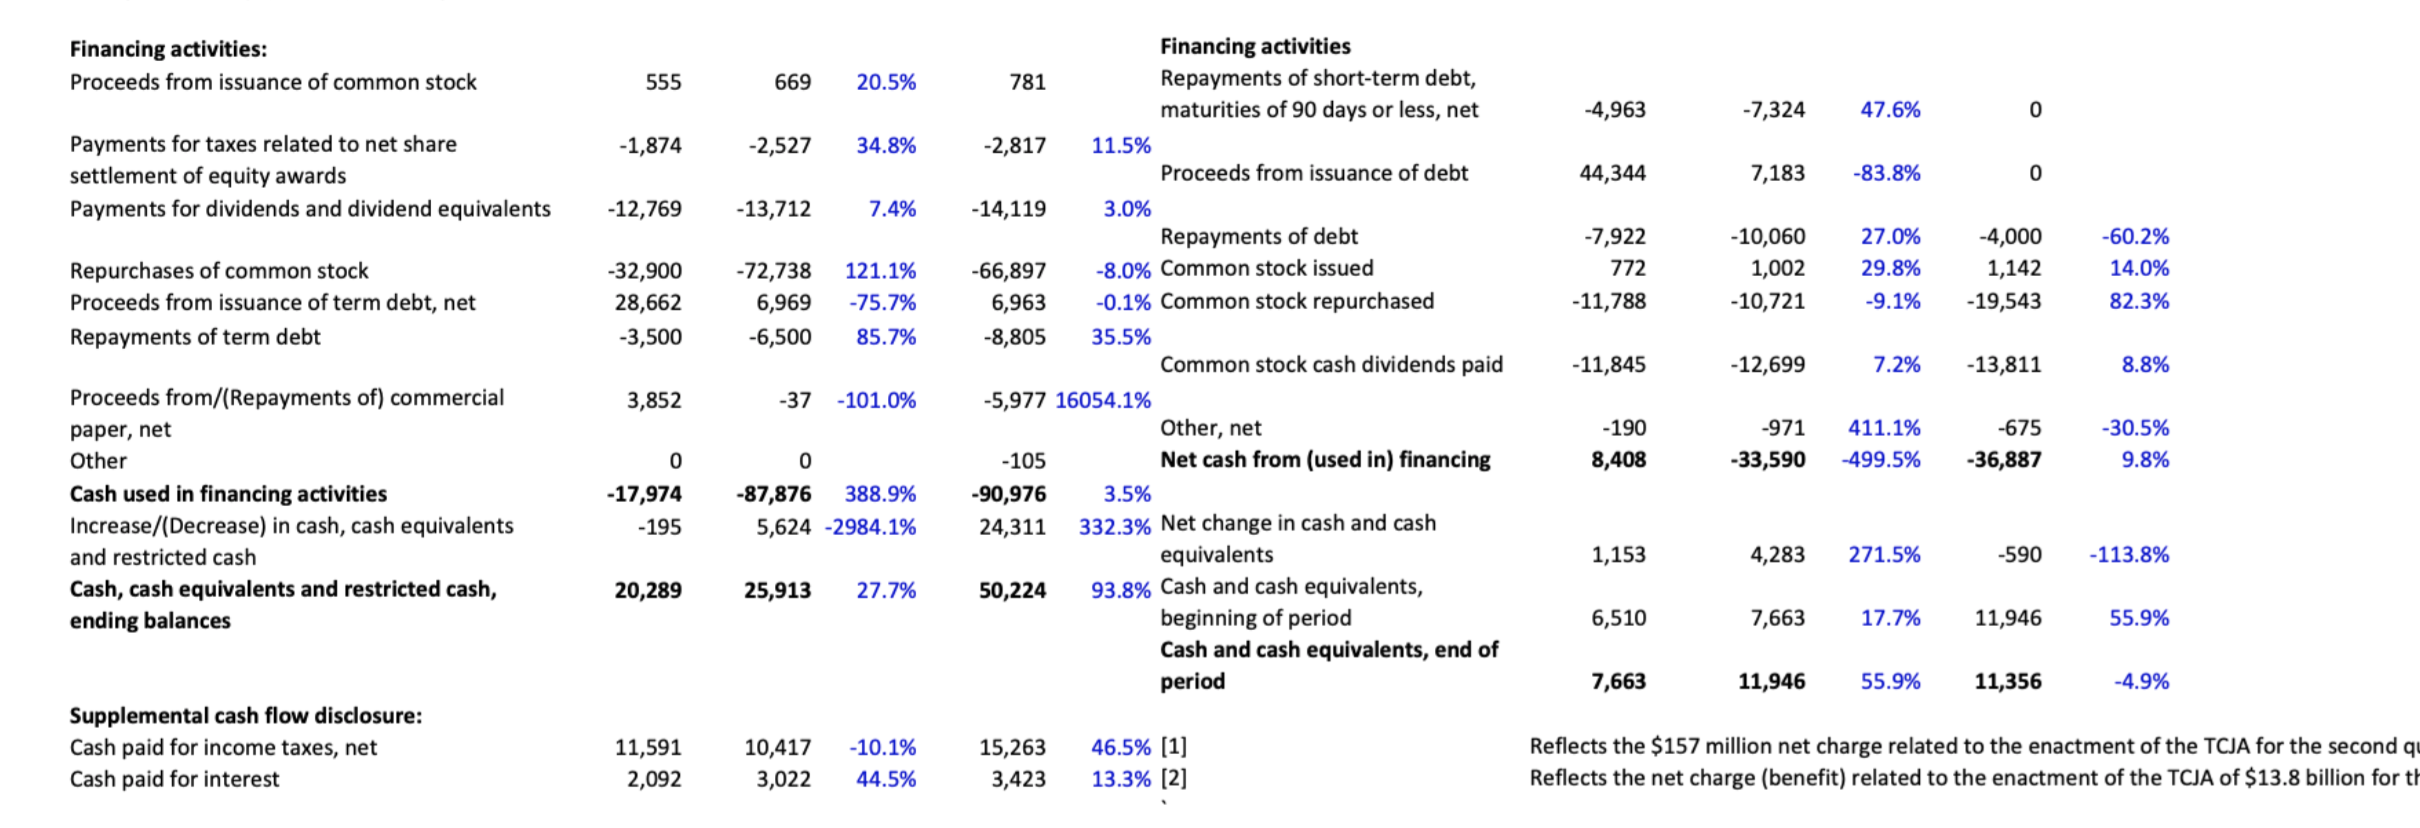
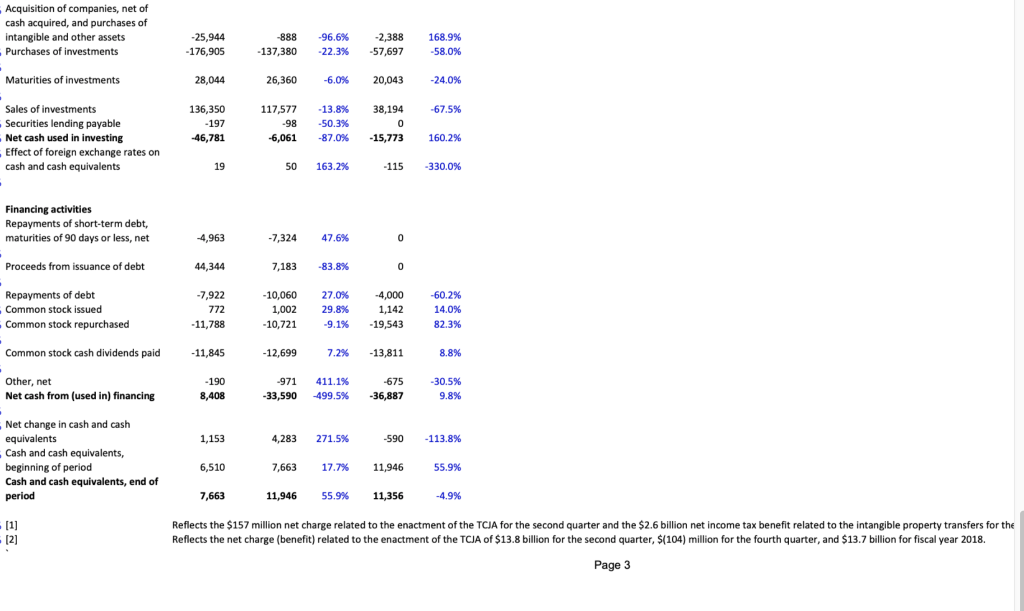
13. How much money did Microsoft repay its short-term and long-term lenders in 2019?
14. For Microsoft, how much money did they spend on the item common stock repurchased?


 15. For Apple, how much money did they spend on the item common stock repurchased?
APPLE CONSOLIDATED STATEMENTS OF CASH 12 Months Sep. 30, 2017 Sep. 29, 2018 % Change % Change MICROSOFT CASH FLOWS STATEMEN 12 Months Ended Sep. 28, % Change % Change Jun 30, 2017 Jun 30, 2018 2019 Jun 30, 201 Operatiing Activities 25,913 27.7% Net income 25,489 (1) 16,571 -35.0% 39,240 20,484 20,289 -1.0% Statement of Cash Flows [Abstract] Cash, cash equivalents and restricted cash, beginning balances Operating activities: 136.8% Adjustments to reconcile net income to net cash from operations: -7.2% Depreciation, amortization, other 48,351 59,531 23.1% 55,256 8.778 10,261 16.9% 11,682 13.8% Net income Adjustments to reconcile net income to cash generated by operating activities: Depreciation and amortization 3,266 3,940 20.6% 4,652 18.1% 10,157 10.903 7.3% -2,073 -829 -2,212 -5,143 6.7% 520.4% -792 -6,463 -64.2% 25.7% Share-based compensation expense Deferred income tax expense/ benefit) 4,840 5,966 5,340 10.3% -32,590-646.3% -166 Other Changes in operating assets and liabilities: Accounts receivable, net Inventories Vendor non-trade receivables Other current and non-current assets Accounts payable Deferred revenue Other current and non-current liabilities Cash generated by operating activities Investing activities: Purchases of marketable securities -2,093 -2,723 -4,254 -5,318 8,966 -593 1,092 64,225 -444 167.5% #DIV/0! -5,322 154.3% 828 -130.4% -8,010 88.3% -423 -92.0% 9,175 2.3% -3 -99.5% 38,449 3421.0% 77,434 20.6% -1,216 50 1,028 -917 81 3,820 1,792 356 -118 39,507 -3,862 217.6% -465 -1030.0% -952 -192.6% -285 -68.9% 1,148 1317.3% 5,922 55.0% 18,183 914.7% 798 124.2% -20 -83.1% 43,884 11.1% -2,812 597 -1,718 -1,834 232 4,462 2,929 1,419 591 52,185 -27.2% -228.4% 80.5% 543.5% -79.8% -24.7% -83.9% 77.8% 3055.0% 18.9% Stock-based compensation expense 12,547 15.1% Net recognized gains on investments and derivatives 6,068 13.6% Deferred income taxes -340 -99.0% Changes in operating assets and liabilities: -652 46.8% Accounts receivable Inventories 245 -104.6% Other current assets -289 -134.9% Other long-term assets 2,931 -136.6% Accounts payable 873 -306.4% Unearned revenue -1,923 -121.0% Income taxes -625 20733.3% Other current liabilities -4,700 -112.2% Other long-term liabilities 69,391 -10.4% Net cash from operations Investing Activities -39,630 -44.5% Additions to property and equipment 40,102 -28.2% Acquisition of companies, net of cash acquired, and purchases of intangible and other assets 56,988 19.1% Purchases of investments -10,495 -21.2% Maturities of investments -624 - 13.5% Sales of investments -1,001 -46.5% Securities lending payable 1,634 362.9% Net cash used in investing -1,078 44.7% Effect of foreign exchange rates on cash and cash equivalents 45,896 185.7% -159,486 -71,356 -55.3% -8,129 -11,632 43.1% -13,925 19.7% 31,775 55,881 75.9% Proceeds from maturities of marketable securities -25,944 - 176,905 -888 -137,380 -96.6% -22.3% -2,388 -57,697 168.9% -58.0% 94,564 -12,451 47,838 -13,313 -49.4% 6.9% 28,044 26,360 -6.0% 20,043 -24.0% -329 -721 119.1% Proceeds from sales of marketable securities Payments for acquisition of property, plant and equipment Payments made in connection with business acquisitions, net Purchases of non-marketable securities - Proceeds from non-marketable securities Other -67.5% -521 126 -124 -1,871 353 -745 259.1% 180.2% 500.8% 136,350 -197 -46,781 117,577 -98 -6,061 - 13.8% -50.3% -87.0% 38,194 0 -15.773 160.2% 19 50 163.2% - 115 -330.0% Cash generated by/(used in) Investing activities -46,446 16,066 -134.6% Financing activities: Proceeds from issuance of common stock 555 669 20.5% -4,963 -7,324 47.6% 0 -1,874 -2,527 34.8% Payments for taxes related to net share settlement of equity awards Payments for dividends and dividend equivalents 44,344 7,183 -83.8% 0 -12,769 -13,712 7.4% Repurchases of common stock Proceeds from issuance of term debt, net Repayments of term debt -32,900 28,662 -3,500 -72,738 6,969 -6,500 121.1% -75.7% 85.7% -7,922 772 -11,788 -10,060 1,002 -10,721 27.0% 29.8% -9.1% -4,000 1,142 -19,543 -60.2% 14.0% 82.3% Financing activities 781 Repayments of short-term debt, maturities of 90 days or less, net -2,817 11.5% Proceeds from issuance of debt -14,119 3.0% Repayments of debt -66,897 -8.0% Common stock issued 6,963 -0.1% Common stock repurchased -8,805 35.5% Common stock cash dividends paid -5,977 16054.1% Other, net -105 Net cash from (used in) financing -90,976 3.5% 24,311 332.3% Net change in cash and cash equivalents 50,224 93.8% Cash and cash equivalents, beginning of period Cash and cash equivalents, end of period -11,845 -12,699 7.2% -13,811 8.8% 3,852 -37 -101.0% -190 8,408 -971 -33,590 411.1% -499.5% -675 -36,887 -30.5% 9.8% 0 Proceeds from/(Repayments of) commercial paper, net Other Cash used in financing activities Increase/(Decrease) in cash, cash equivalents and restricted cash Cash, cash equivalents and restricted cash, ending balances -17,974 -195 0 -87,876 388.9% 5,624 -2984.1% 1,153 4,283 271.5% -590 -113.8% 20,289 25,913 27.7% 6,510 7,663 17.7% 11,946 55.9% 7,663 11,946 55.9% 11,356 -4.9% Supplemental cash flow disclosure: Cash paid for income taxes, net Cash paid for interest 11,591 2,092 10,417 3,022 -10.1% 44.5% 15,263 3,423 46.5% [1] 13.3% [2] Reflects the $157 million net charge related to the enactment of the TCJA for the second qi Reflects the net charge (benefit) related to the enactment of the TCJA of $13.8 billion for th Acquisition of companies, net of cash acquired, and purchases of intangible and other assets Purchases of investments -25,944 -176,905 -888 - 137,380 -96.6% -22.3% -2,388 -57,697 168.9% -58.0% 28,044 26,360 -6.0% 20,043 -24.0% Maturities of investments Sales of investments Securities lending payable Net cash used in investing Effect of foreign exchange rates on cash and cash equivalents 136,350 -197 -67.5% 117,577 -98 -6,061 -13.8% -50.3% -87.0% 38.194 0 -15,773 46.781 160.2% 19 50 163.2% -115 -330.0% Financing activities Repayments of short-term debt, maturities of 90 days or less, net -4,963 -7,324 47.6% 0 Proceeds from issuance of debt 44,344 7,183 -83.8% 0 Repayments of debt Common stock issued Common stock repurchased -7,922 772 -11,788 -10,060 1,002 -10,721 27.0% 29.8% -9.1% -4,000 1,142 -19,543 -60.2% 14.0% 82.3% Common stock cash dividends paid -11,845 -12,699 7.2% -13,811 8.8% Other, net Net cash from (used in) financing -190 8,408 -971 -33,590 411.1% -499.5% -675 -36,887 -30.5% 9.8% 1,153 4,283 271.5% -590 -113.8% Net change in cash and cash equivalents Cash and cash equivalents, beginning of period Cash and cash equivalents, end of period 6,510 7,663 17.7% 11,946 55.9% 7,663 11,946 55.9% 11,356 -4.9% [1] 2] Reflects the $157 million net charge related to the enactment of the TCJA for the second quarter and the $2.6 billion net income tax benefit related to the intangible property transfers for the Reflects the net charge (benefit) related to the enactment of the TCJA of $13.8 billion for the second quarter, $(104) million for the fourth quarter, and $13.7 billion for fiscal year 2018. Page 3


 15. For Apple, how much money did they spend on the item common stock repurchased?


