

Answered step by step
Verified Expert Solution
Question
1 Approved Answer
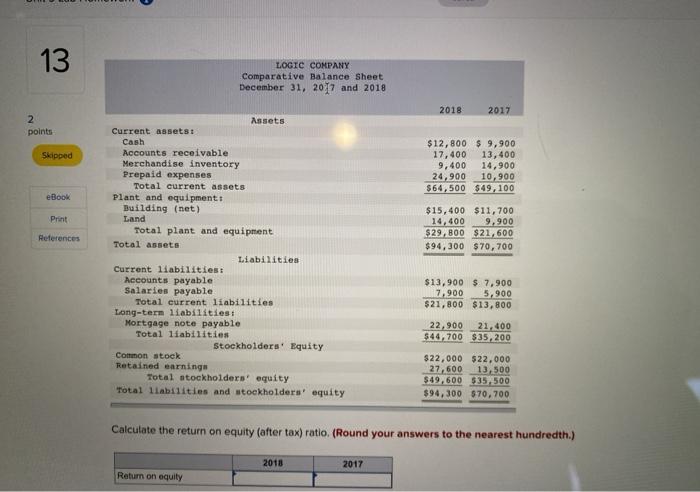
13 LOGIC COMPANY Comparative Balance Sheet December 31, 2017 and 2018 2018 2017 2 points Skipped $12,800 $ 9,900 17,400 13,400 9,400 14,900 24,900 10,900
Step by Step Solution
There are 3 Steps involved in it
Step: 1

Get Instant Access to Expert-Tailored Solutions
See step-by-step solutions with expert insights and AI powered tools for academic success
Step: 2

Step: 3
Ace Your Homework with AI
Get the answers you need in no time with our AI-driven, step-by-step assistance
Get Started
ACCOUNTING JOB QUESTIONS AND ANSWERS Trainee Accountants Handbook
Authors: Sterling Libs FCCA
1st Edition
1911037129, 978-1911037125