

Answered step by step
Verified Expert Solution
Question
1 Approved Answer
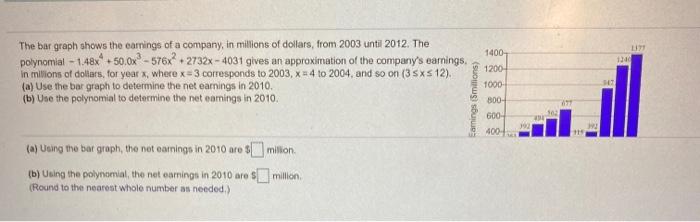
1300 The bar graph shows the earnings of a company, in millions of dollars, from 2003 until 2012. The polynomial -1.48x + 50.0x - 576x
Step by Step Solution
There are 3 Steps involved in it
Step: 1

Get Instant Access to Expert-Tailored Solutions
See step-by-step solutions with expert insights and AI powered tools for academic success
Step: 2

Step: 3
Ace Your Homework with AI
Get the answers you need in no time with our AI-driven, step-by-step assistance
Get Started
Crypto Scams How To Avoid Bitcoin And Cryptocurrency Scams
Authors: Michael Toland
1st Edition
1998038491, 978-1998038497