14. Find the maximum value. a. 27 b. 40 C. 26 d. 41 15. What is the shape of the stemplot? a. Symmetric b. Skewed
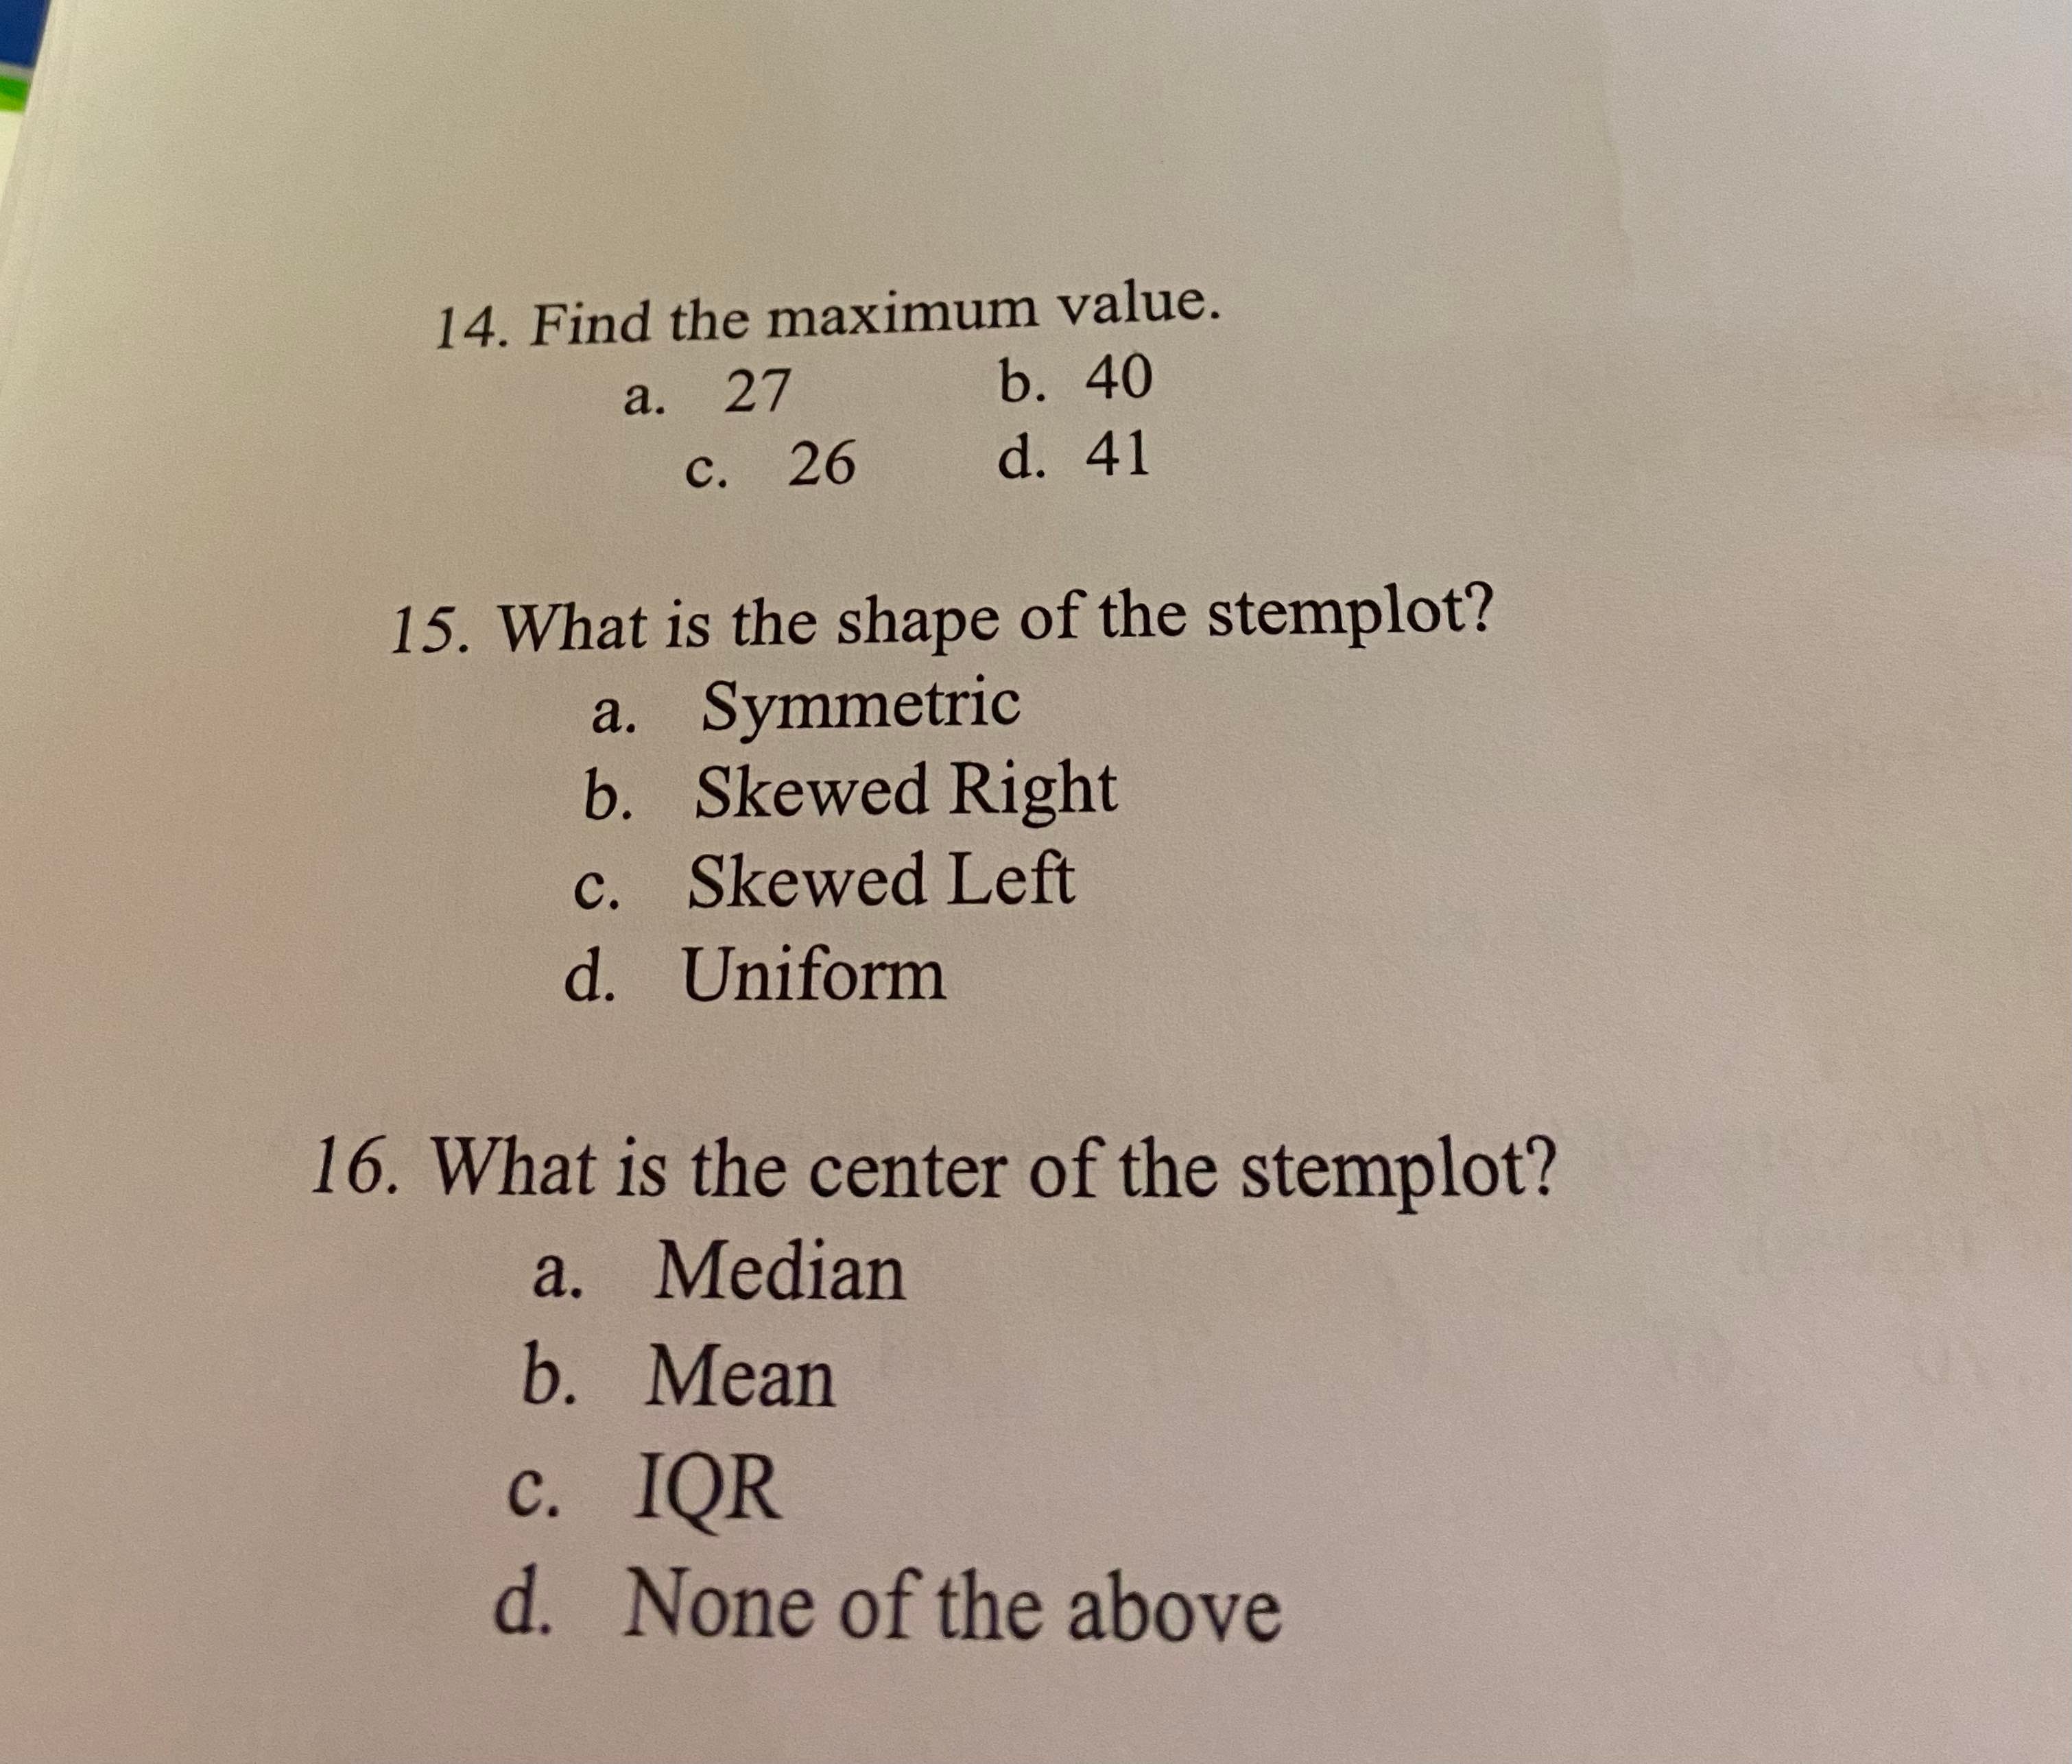
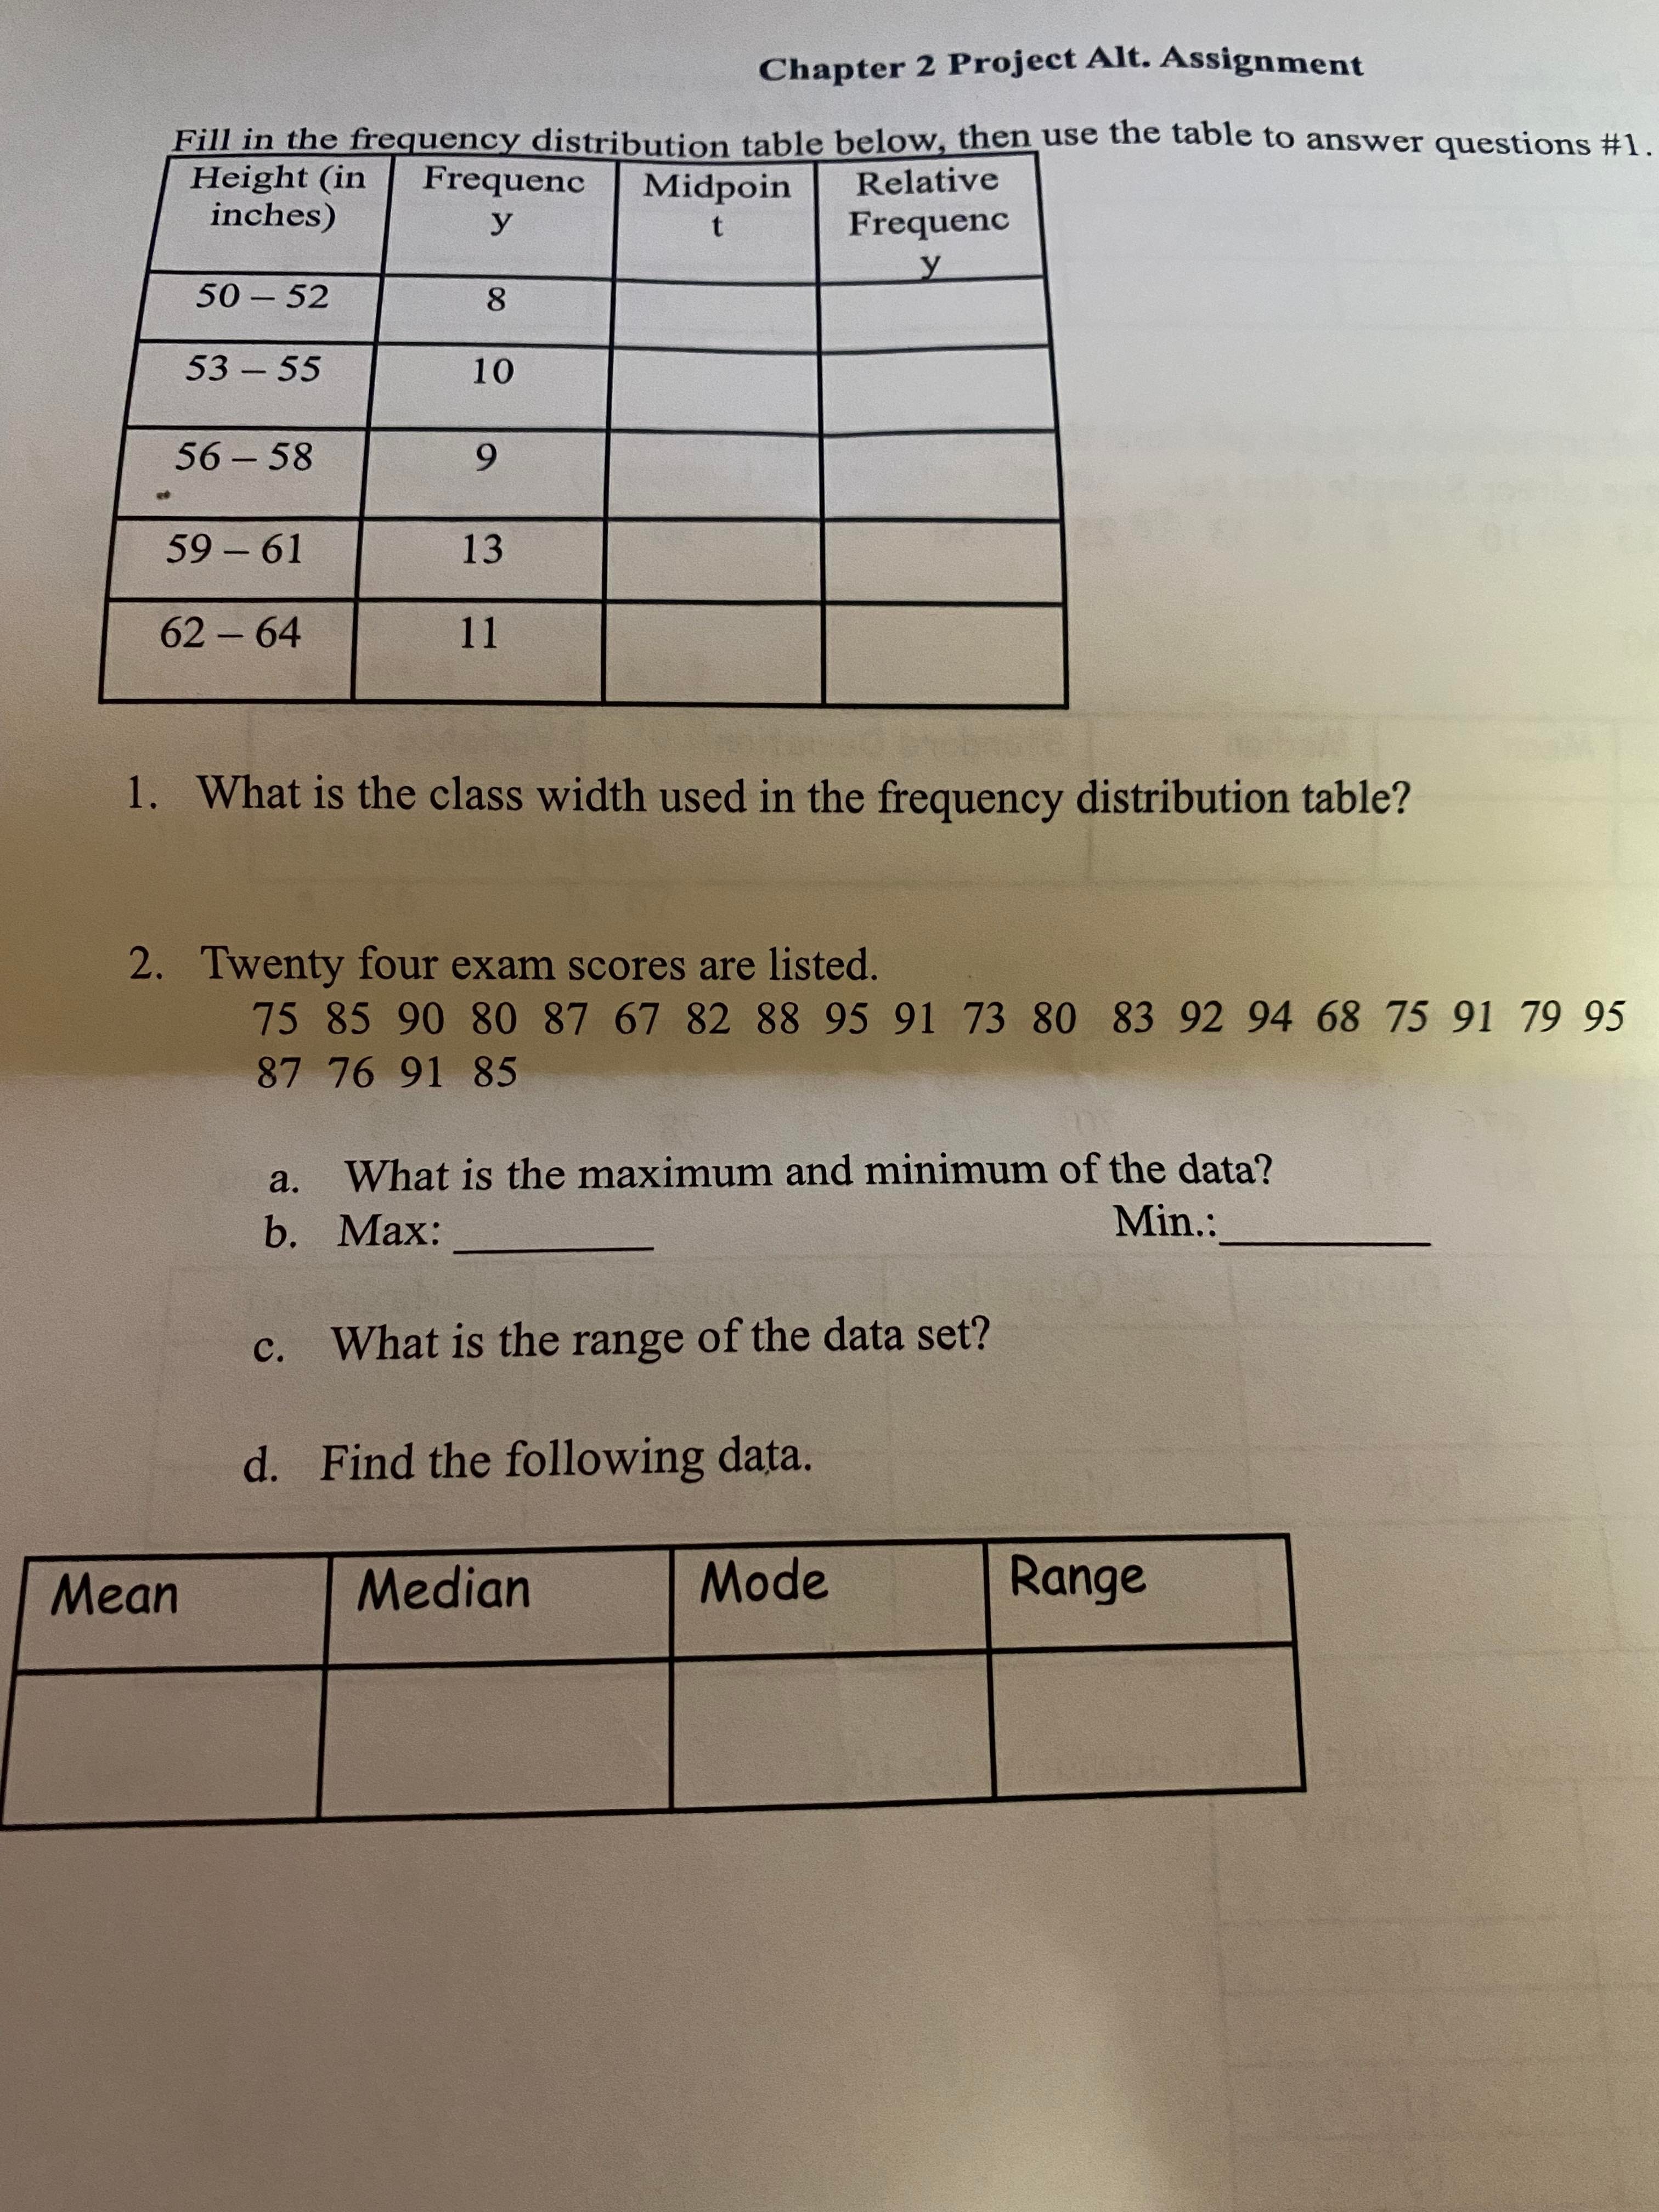
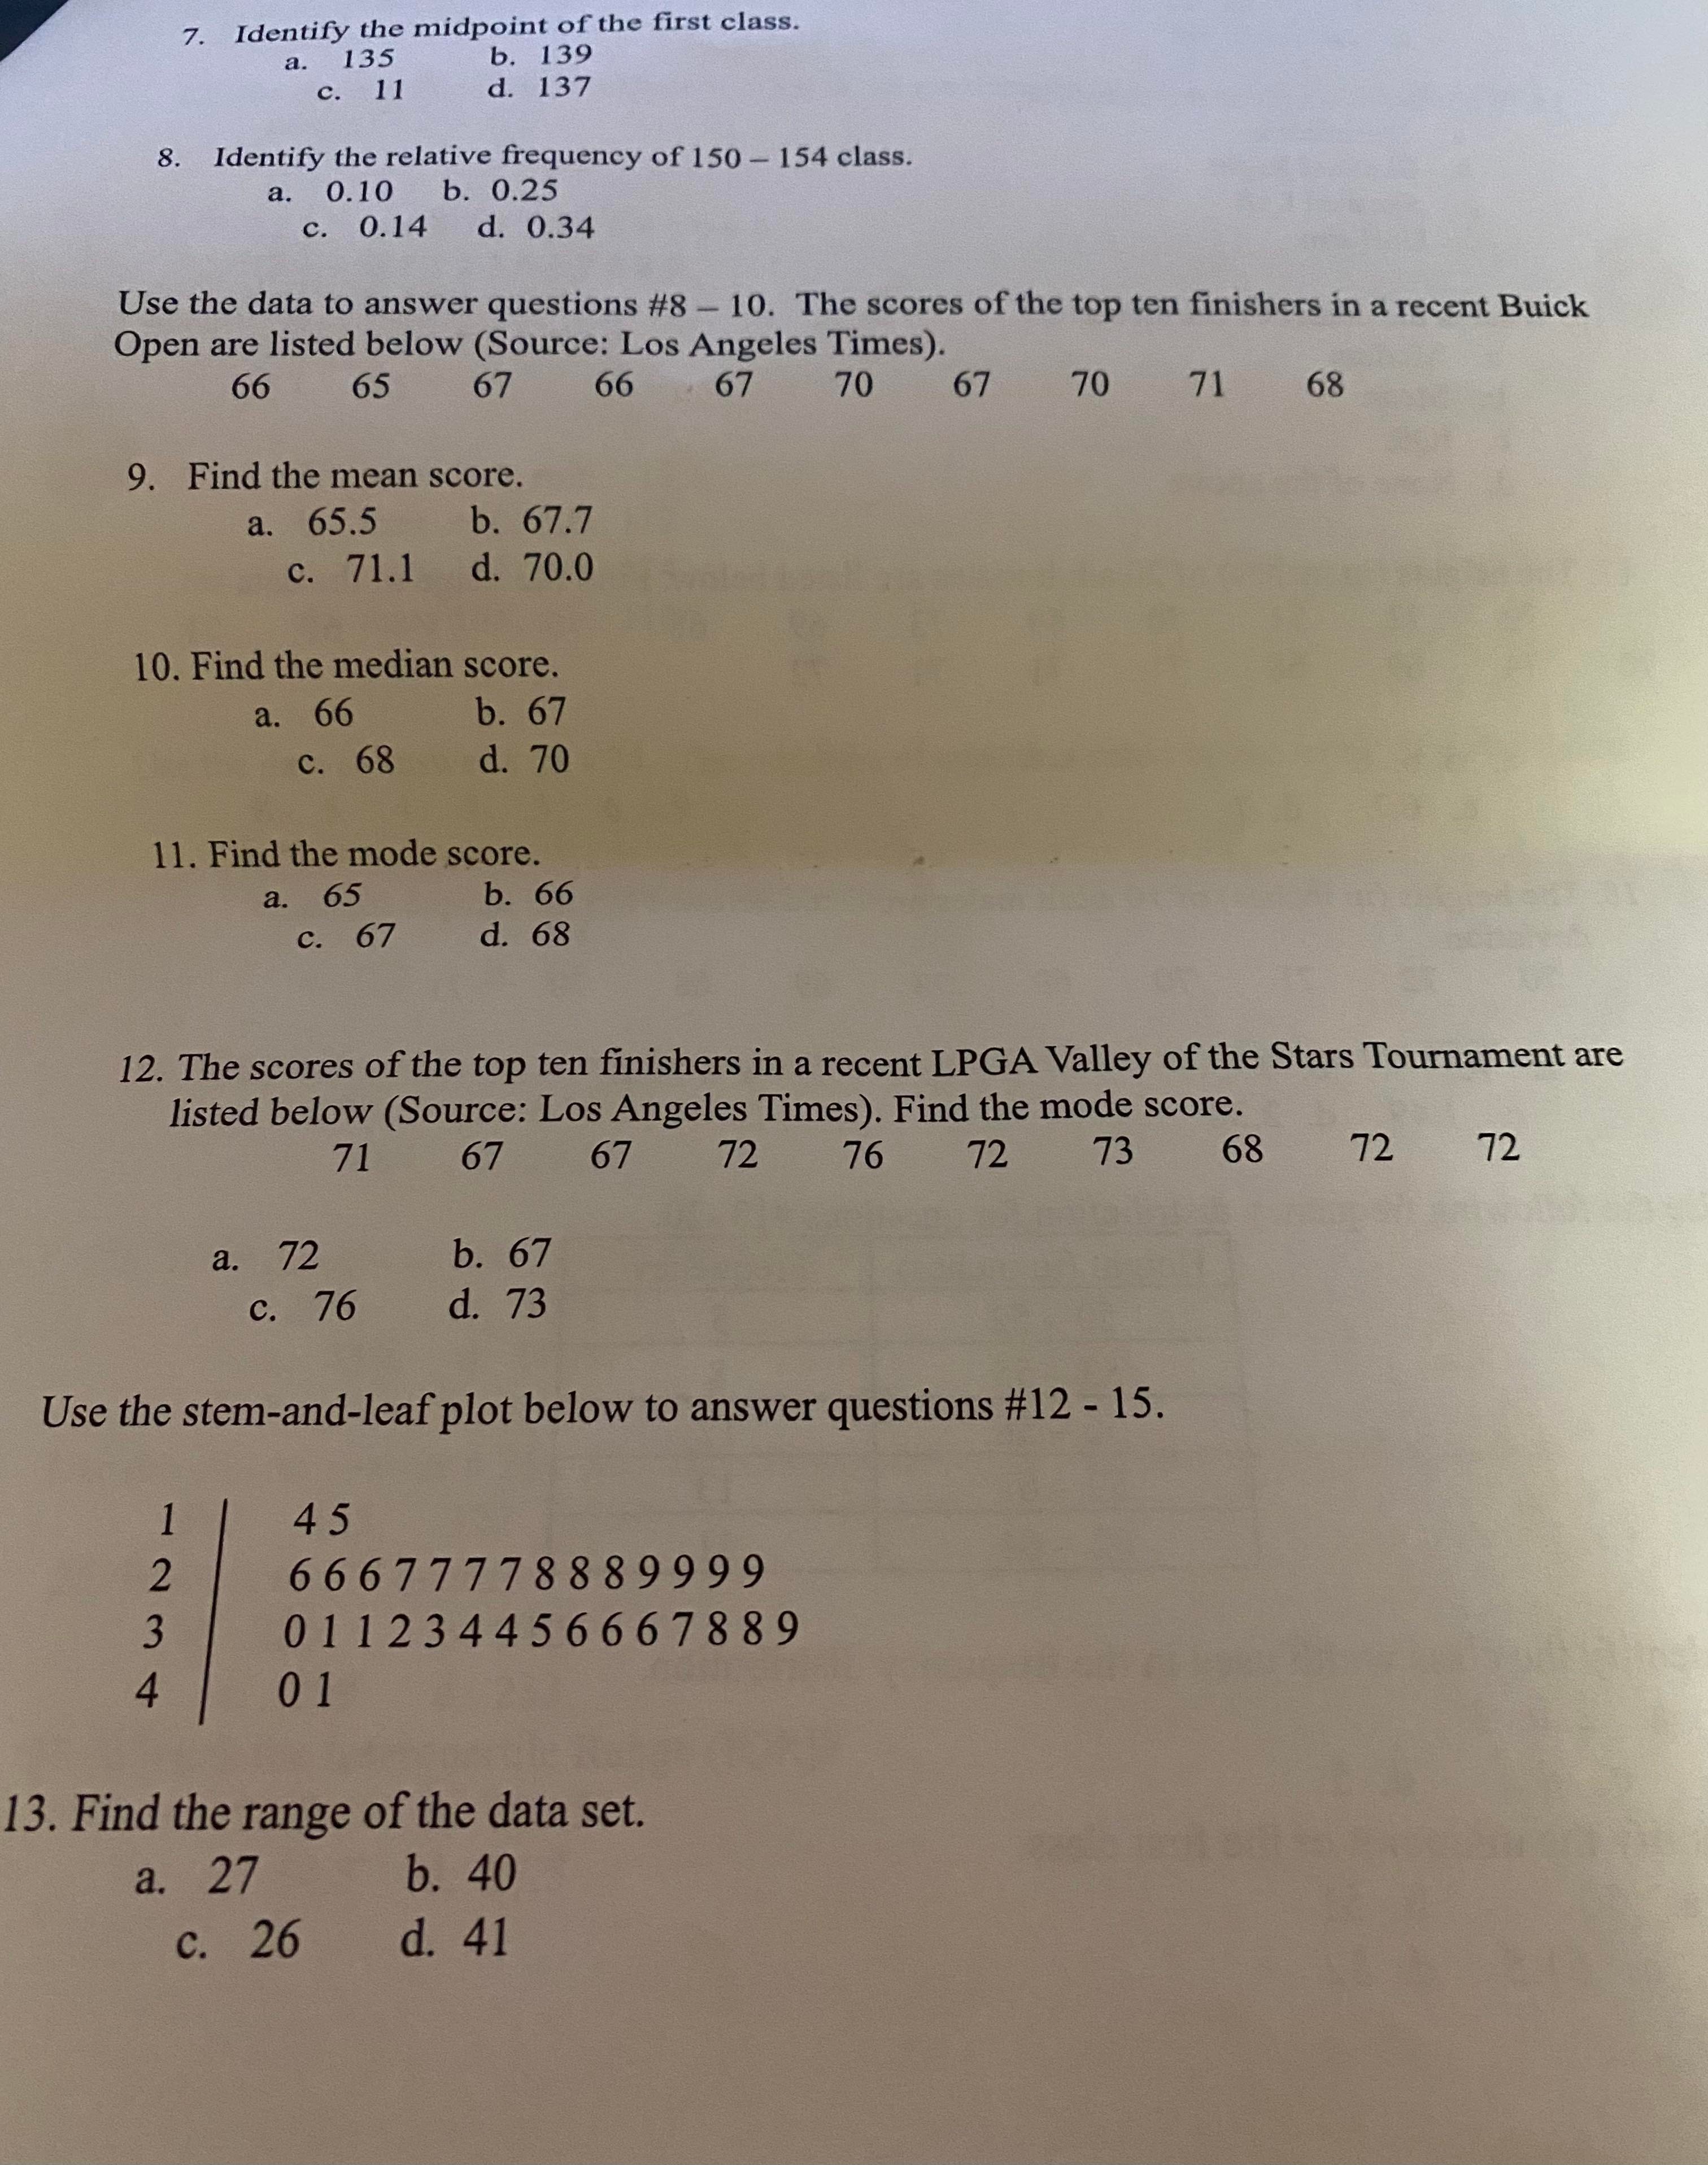
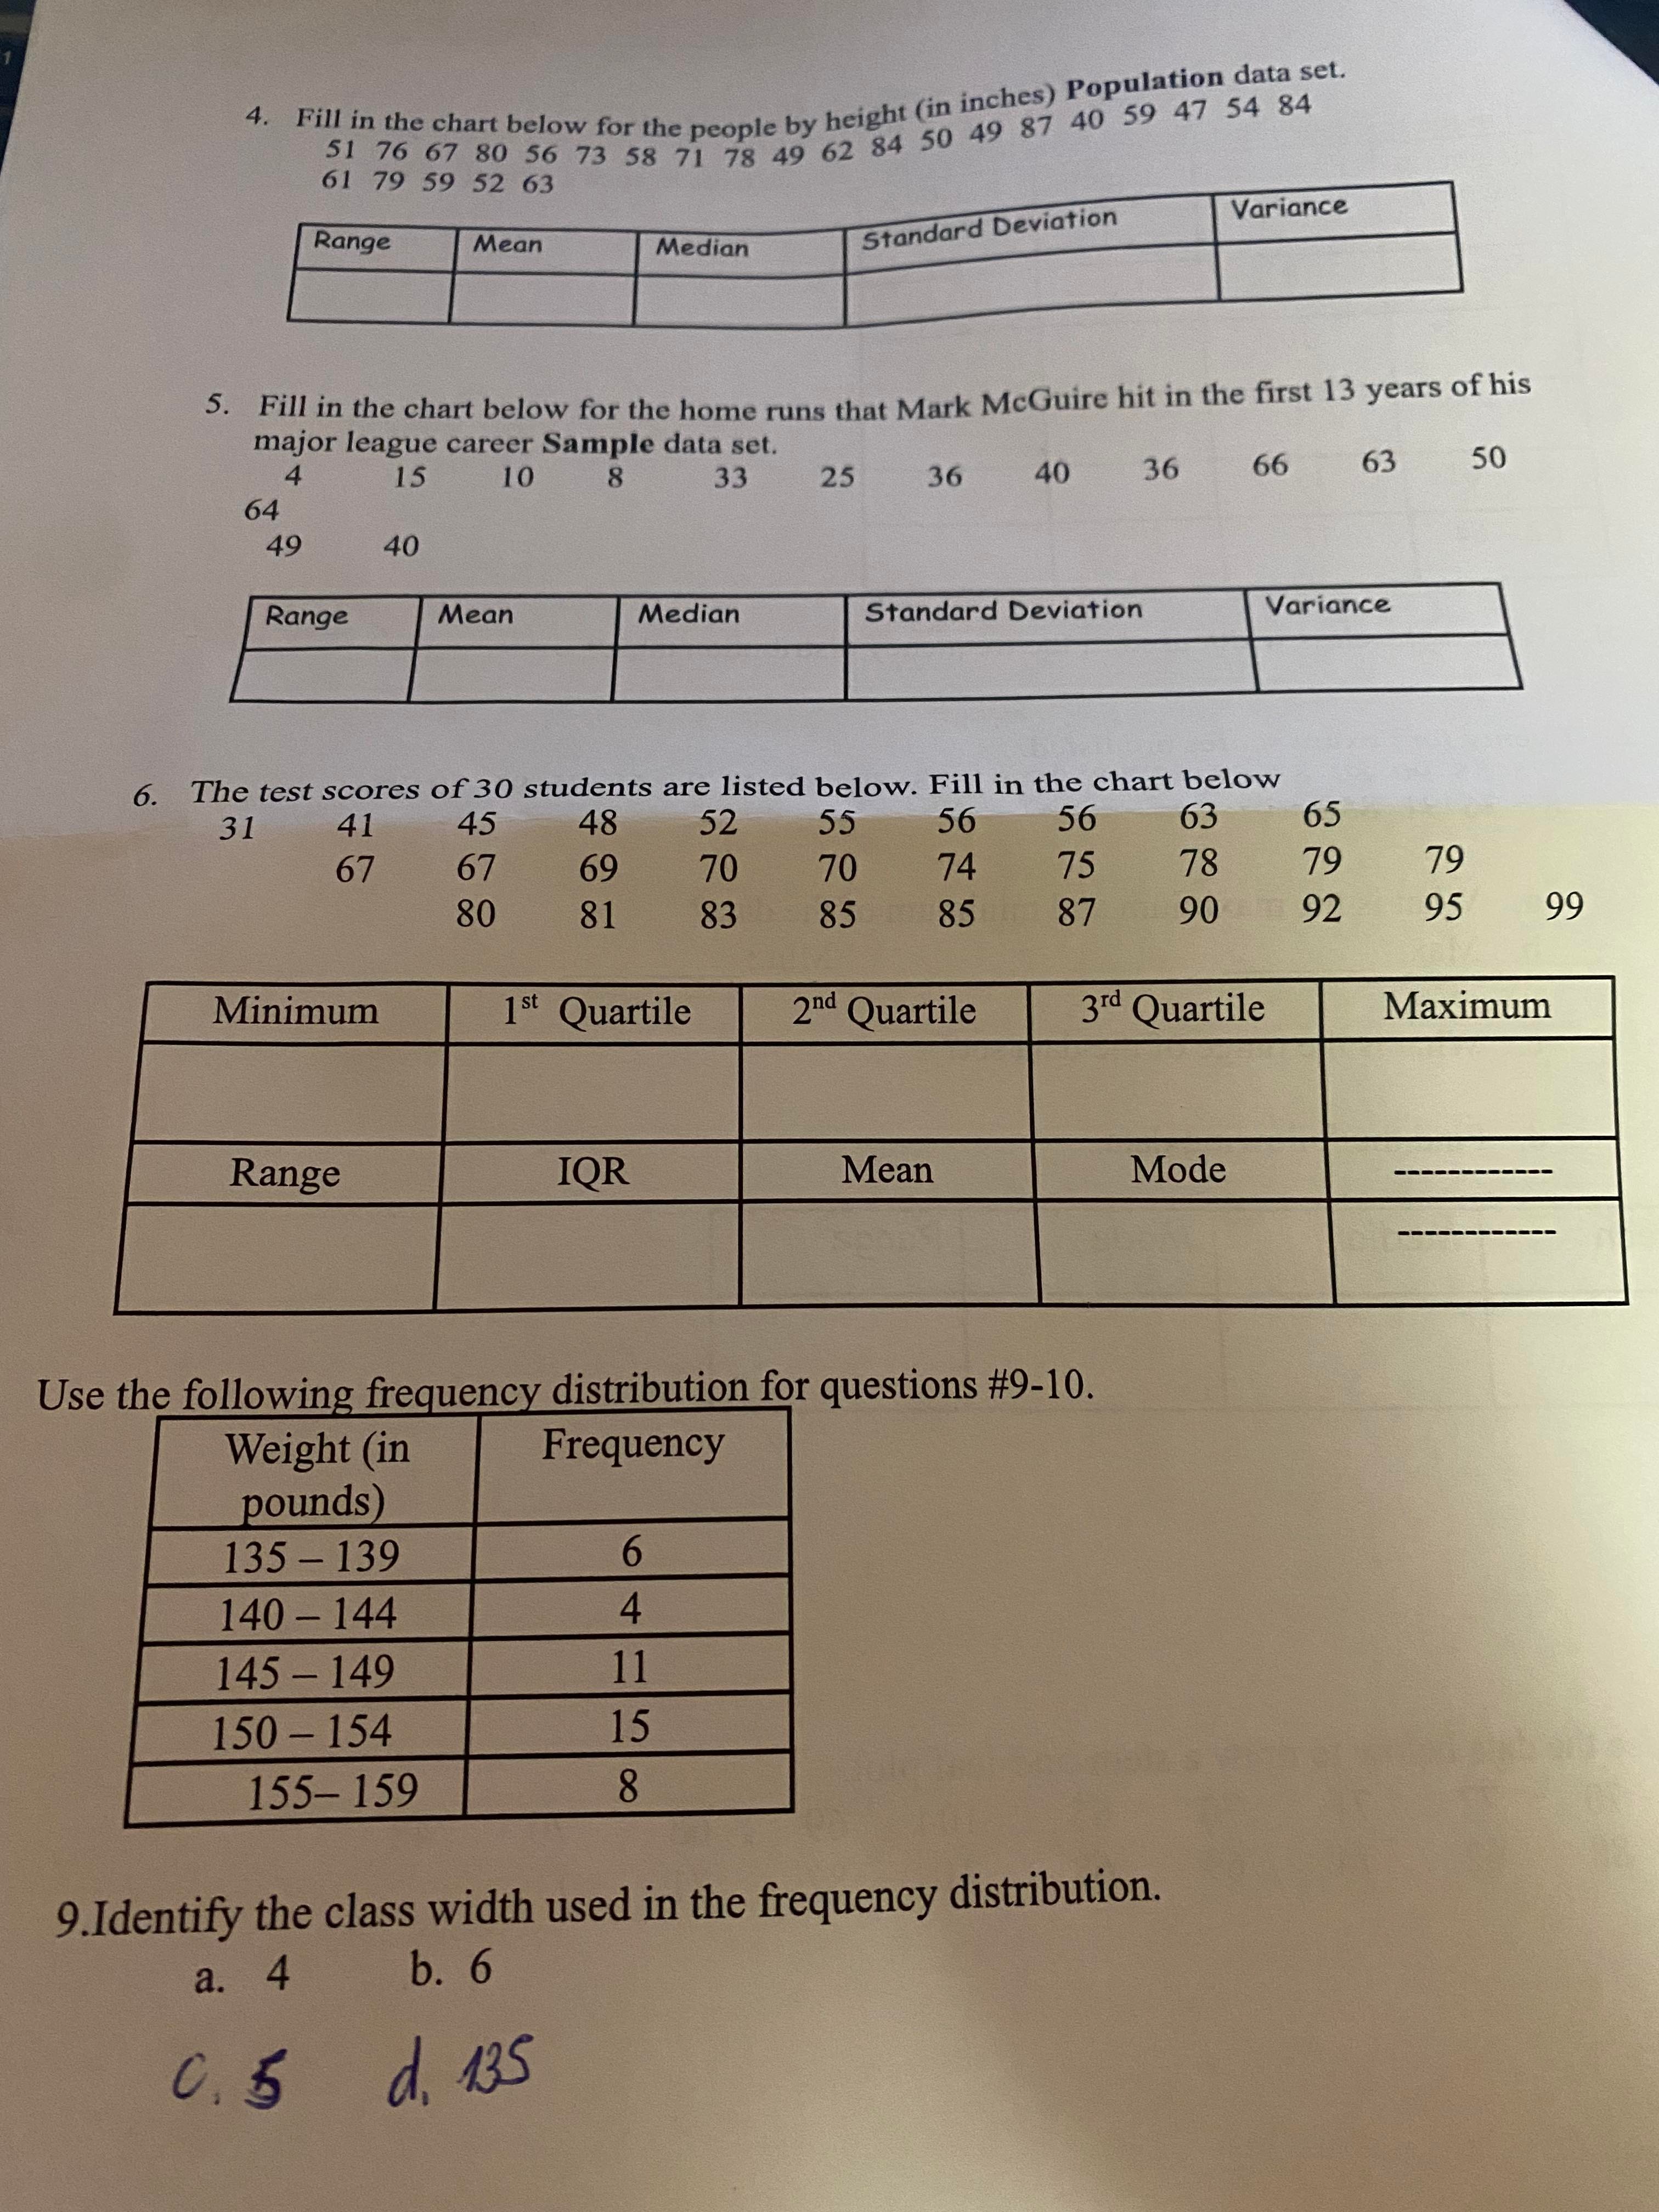
14. Find the maximum value. a. 27 b. 40 C. 26 d. 41 15. What is the shape of the stemplot? a. Symmetric b. Skewed Right c. Skewed Left d. Uniform 16. What is the center of the stemplot? a. Median b. Mean c. IQR d. None of the aboveChapter 2 Project Alt. Assignment Fill in the frequency distribution table below, then use the table to answer questions #1 Height (in Frequenc Midpoin Relative inches) y Frequenc Ly 50-52 8 53-55 10 56-58 9 59 - 61 13 62 - 64 11 1. What is the class width used in the frequency distribution table? 2. Twenty four exam scores are listed. 75 85 90 80 87 67 82 88 95 91 73 80 83 92 94 68 75 91 79 95 87 76 91 85 a. What is the maximum and minimum of the data? b. Max: Min.: c. What is the range of the data set? d. Find the following data. Mean Median Mode Range7. Identify the midpoint of the first class. a. 135 b. 139 C. 11 d. 137 8. Identify the relative frequency of 150 - 154 class. a. 0.10 b. 0.25 c. 0.14 d. 0.34 Use the data to answer questions #8 - 10. The scores of the top ten finishers in a recent Buick Open are listed below (Source: Los Angeles Times). 66 65 67 66 67 70 67 70 71 68 9. Find the mean score. a. 65.5 b. 67.7 c. 71.1 d. 70.0 10. Find the median score. a. 66 b. 67 C. 68 d. 70 11. Find the mode score. a. 65 b. 66 C . 67 d. 68 12. The scores of the top ten finishers in a recent LPGA Valley of the Stars Tournament are listed below (Source: Los Angeles Times). Find the mode score. 71 67 67 72 76 72 73 68 72 72 a. 72 b. 67 C. 76 d. 73 Use the stem-and-leaf plot below to answer questions #12 - 15. 45 6 6 6 7 7 7 78 889999 AWN- 011234 456667889 01 13. Find the range of the data set. a. 27 b. 40 C. 26 d. 41. Fill in the chart below for the people by height (in inches) Population data set. 51 76 67 80 56 73 58 71 78 49 62 84 50 49 87 40 59 47 54 84 61 79 59 52 63 Range Mean Median Standard Deviation Variance 5. Fill in the chart below for the home runs that Mark McGuire hit in the first 13 years of his major league career Sample data set. 4 15 10 8 33 25 36 40 36 66 63 50 64 49 40 Range Mean Median Standard Deviation Variance 6. The test scores of 30 students are listed below. Fill in the chart below 31 41 45 48 52 55 56 56 63 65 67 67 69 70 70 74 75 78 79 79 80 81 83 85 85 87 90 92 95 99 Minimum 1 st Quartile 2nd Quartile 3 d Quartile Maximum Range IOR Mean Mode Use the following frequency distribution for questions #9-10. Weight (in Frequency pounds 135 - 139 6 140 - 144 4 145 - 149 11 150 - 154 15 155-159 8 9.Identify the class width used in the frequency distribution. a. 4 b. 6 C. 5 d. 135
Step by Step Solution
There are 3 Steps involved in it
Step: 1
Get Instant Access to Expert-Tailored Solutions
See step-by-step solutions with expert insights and AI powered tools for academic success
Step: 2
Step: 3
Ace Your Homework with AI
Get the answers you need in no time with our AI-driven, step-by-step assistance