Question
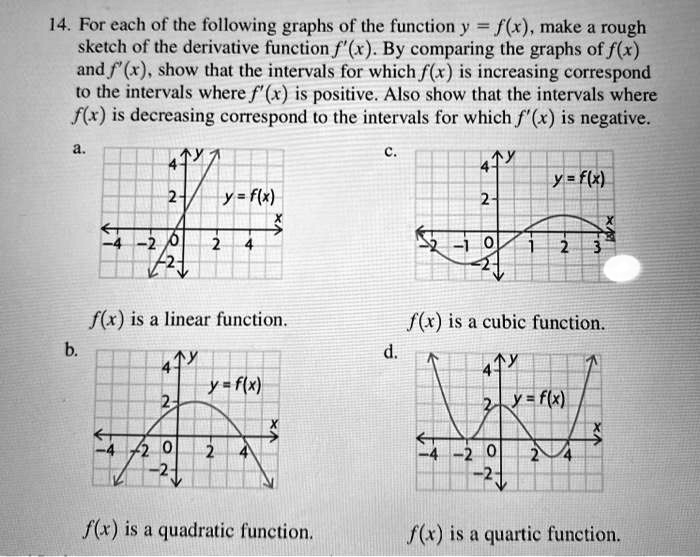
14. For each of the following graphs of the function y = f(x), make a rough sketch of the derivative function f'(x). By comparing


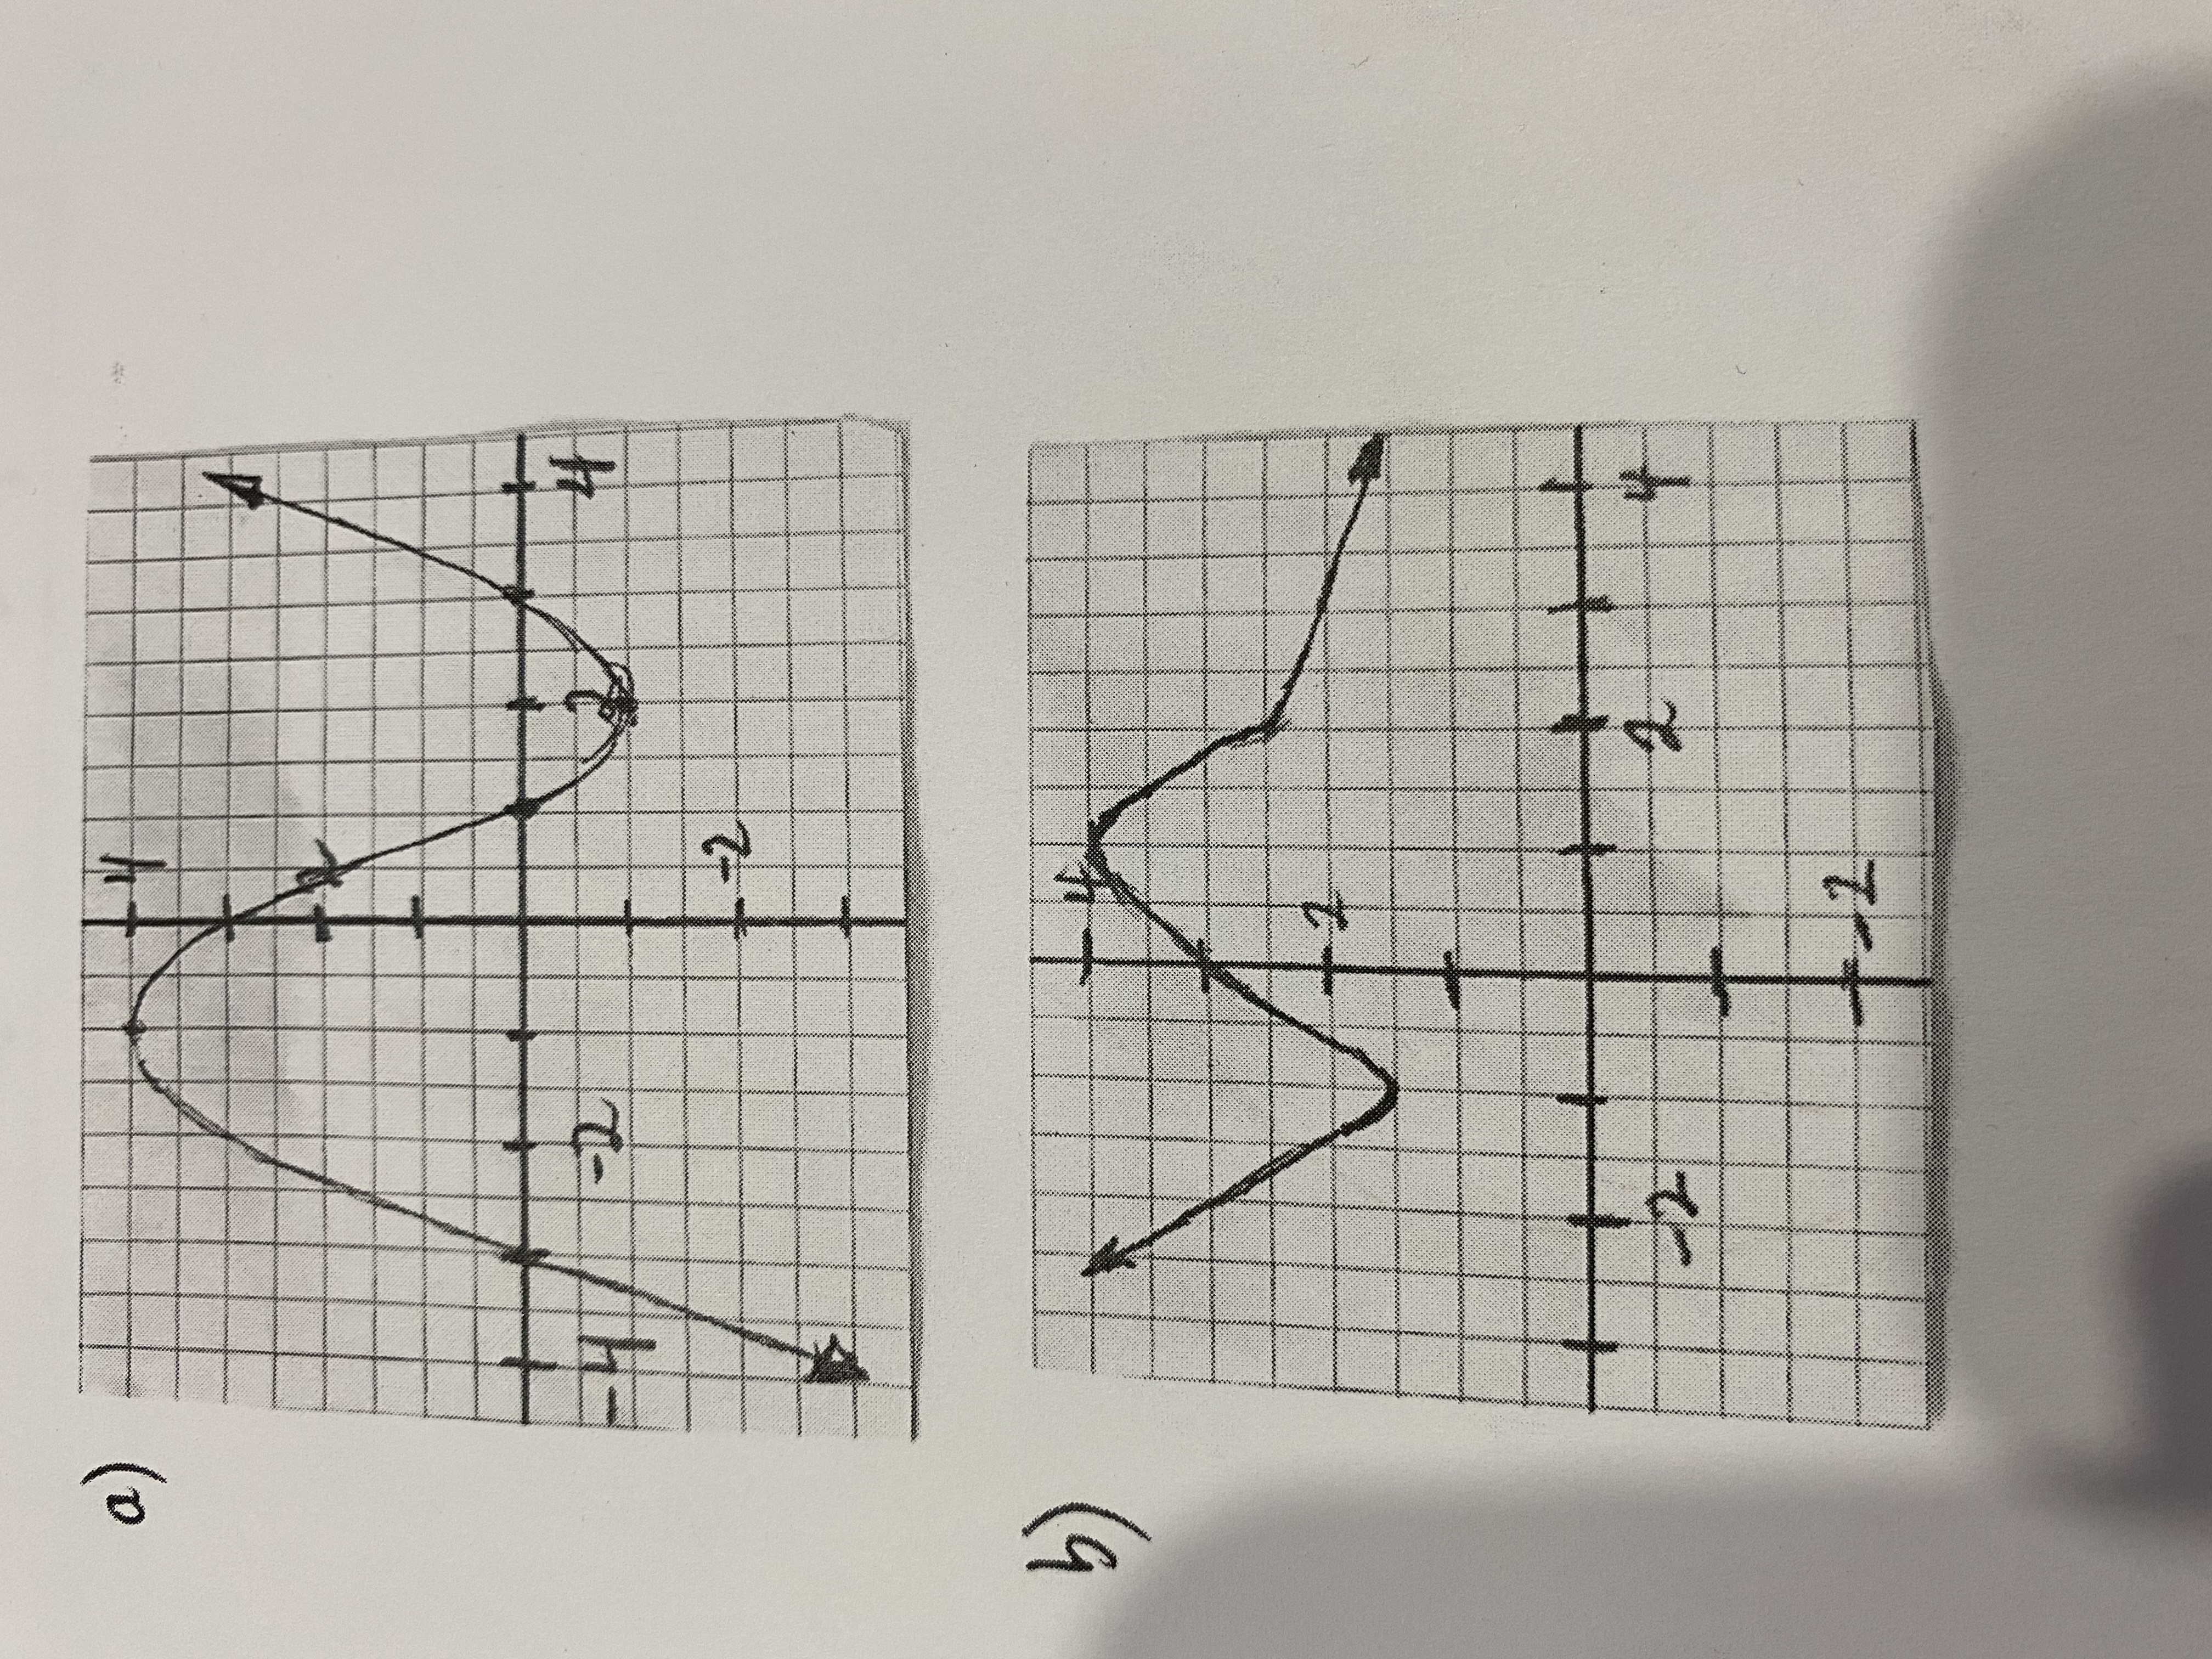
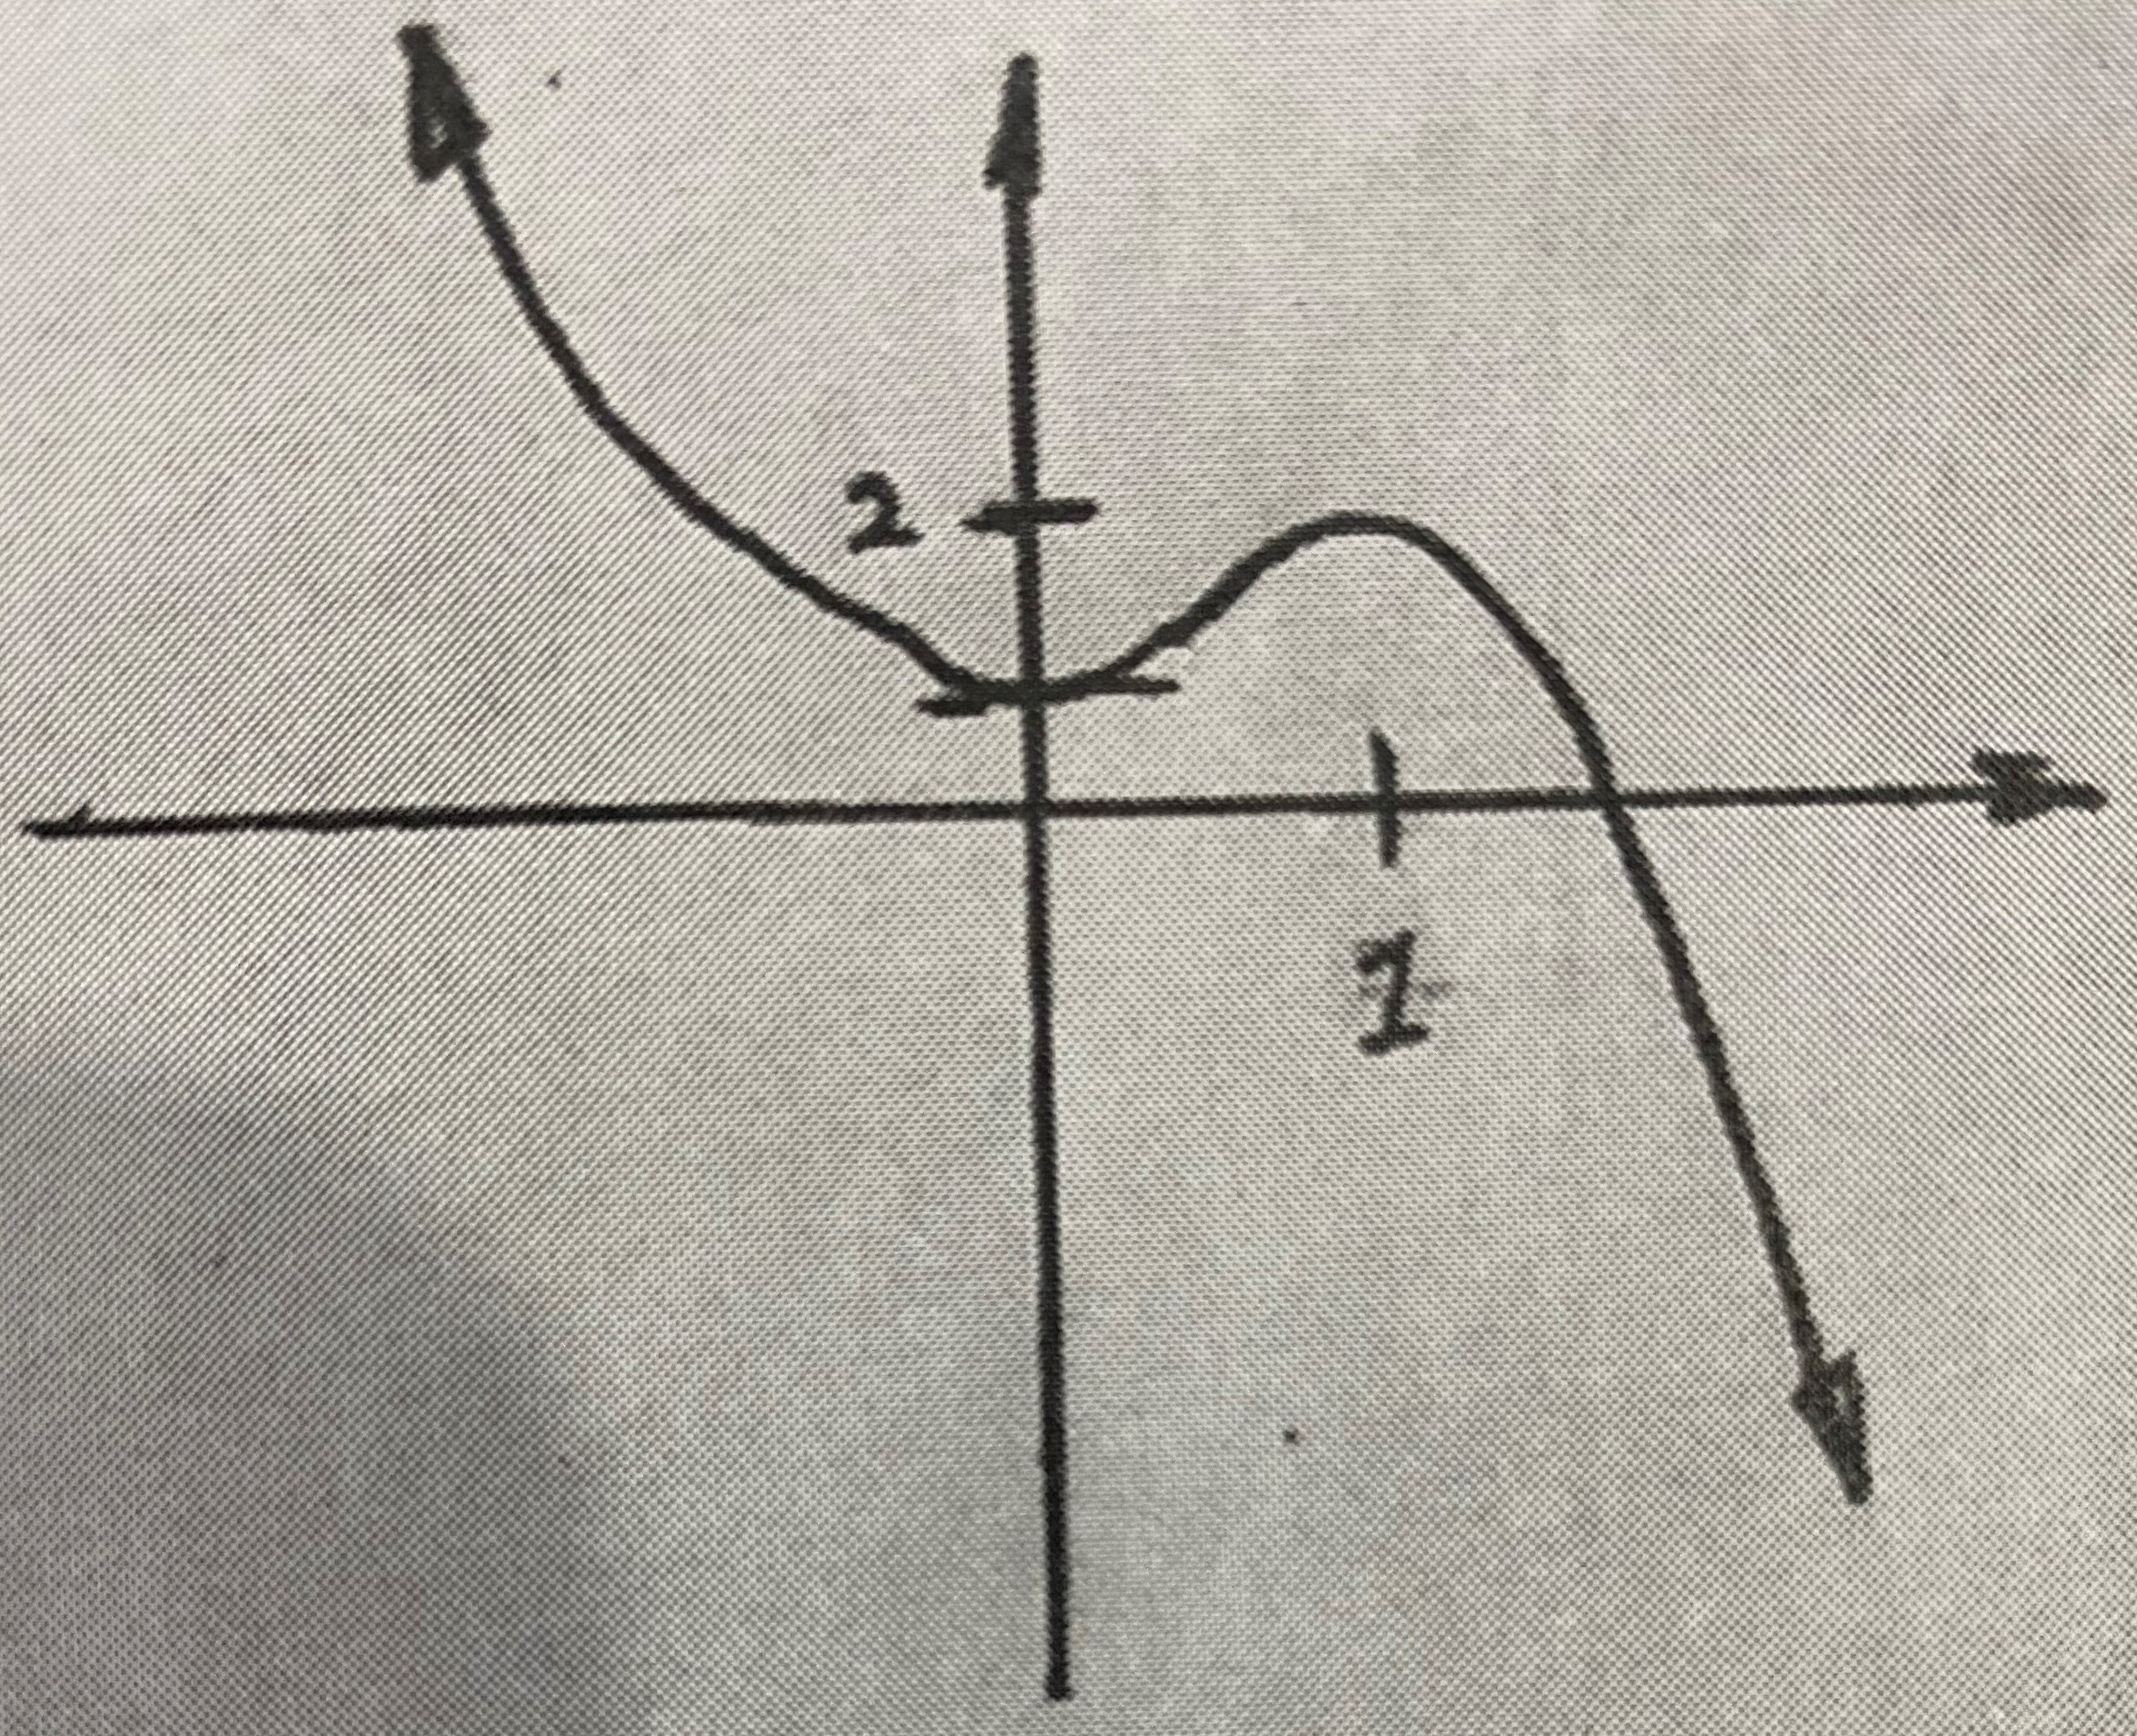
14. For each of the following graphs of the function y = f(x), make a rough sketch of the derivative function f'(x). By comparing the graphs of f(x) and f'(x), show that the intervals for which f(x) is increasing correspond to the intervals where f'(x) is positive. Also show that the intervals where f(x) is decreasing correspond to the intervals for which f'(x) is negative. b. a. 2- y= f(x) -2 2 4 f(x) is a linear function. C. d. y= f(x) 2 20 2 y = f(x) 2- 1 2 3 f(x) is a cubic function. 2y= f(x) -20 2 -2- f(x) is a quadratic function. f(x) is a quartic function. a) 4 =4 2 +-2 4 b) -2 +-2 2 4 1
Step by Step Solution
There are 3 Steps involved in it
Step: 1

Get Instant Access to Expert-Tailored Solutions
See step-by-step solutions with expert insights and AI powered tools for academic success
Step: 2

Step: 3

Ace Your Homework with AI
Get the answers you need in no time with our AI-driven, step-by-step assistance
Get StartedRecommended Textbook for
Probability And Statistical Inference
Authors: Robert V. Hogg, Elliot Tanis, Dale Zimmerman
9th Edition
321923278, 978-0321923271
Students also viewed these Mathematics questions
Question
Answered: 1 week ago
Question
Answered: 1 week ago
Question
Answered: 1 week ago
Question
Answered: 1 week ago
Question
Answered: 1 week ago
Question
Answered: 1 week ago
Question
Answered: 1 week ago
Question
Answered: 1 week ago
Question
Answered: 1 week ago
Question
Answered: 1 week ago
Question
Answered: 1 week ago
Question
Answered: 1 week ago
Question
Answered: 1 week ago
Question
Answered: 1 week ago
Question
Answered: 1 week ago
Question
Answered: 1 week ago
Question
Answered: 1 week ago
Question
Answered: 1 week ago
Question
Answered: 1 week ago
Question
Answered: 1 week ago
Question
Answered: 1 week ago
View Answer in SolutionInn App


