


14)
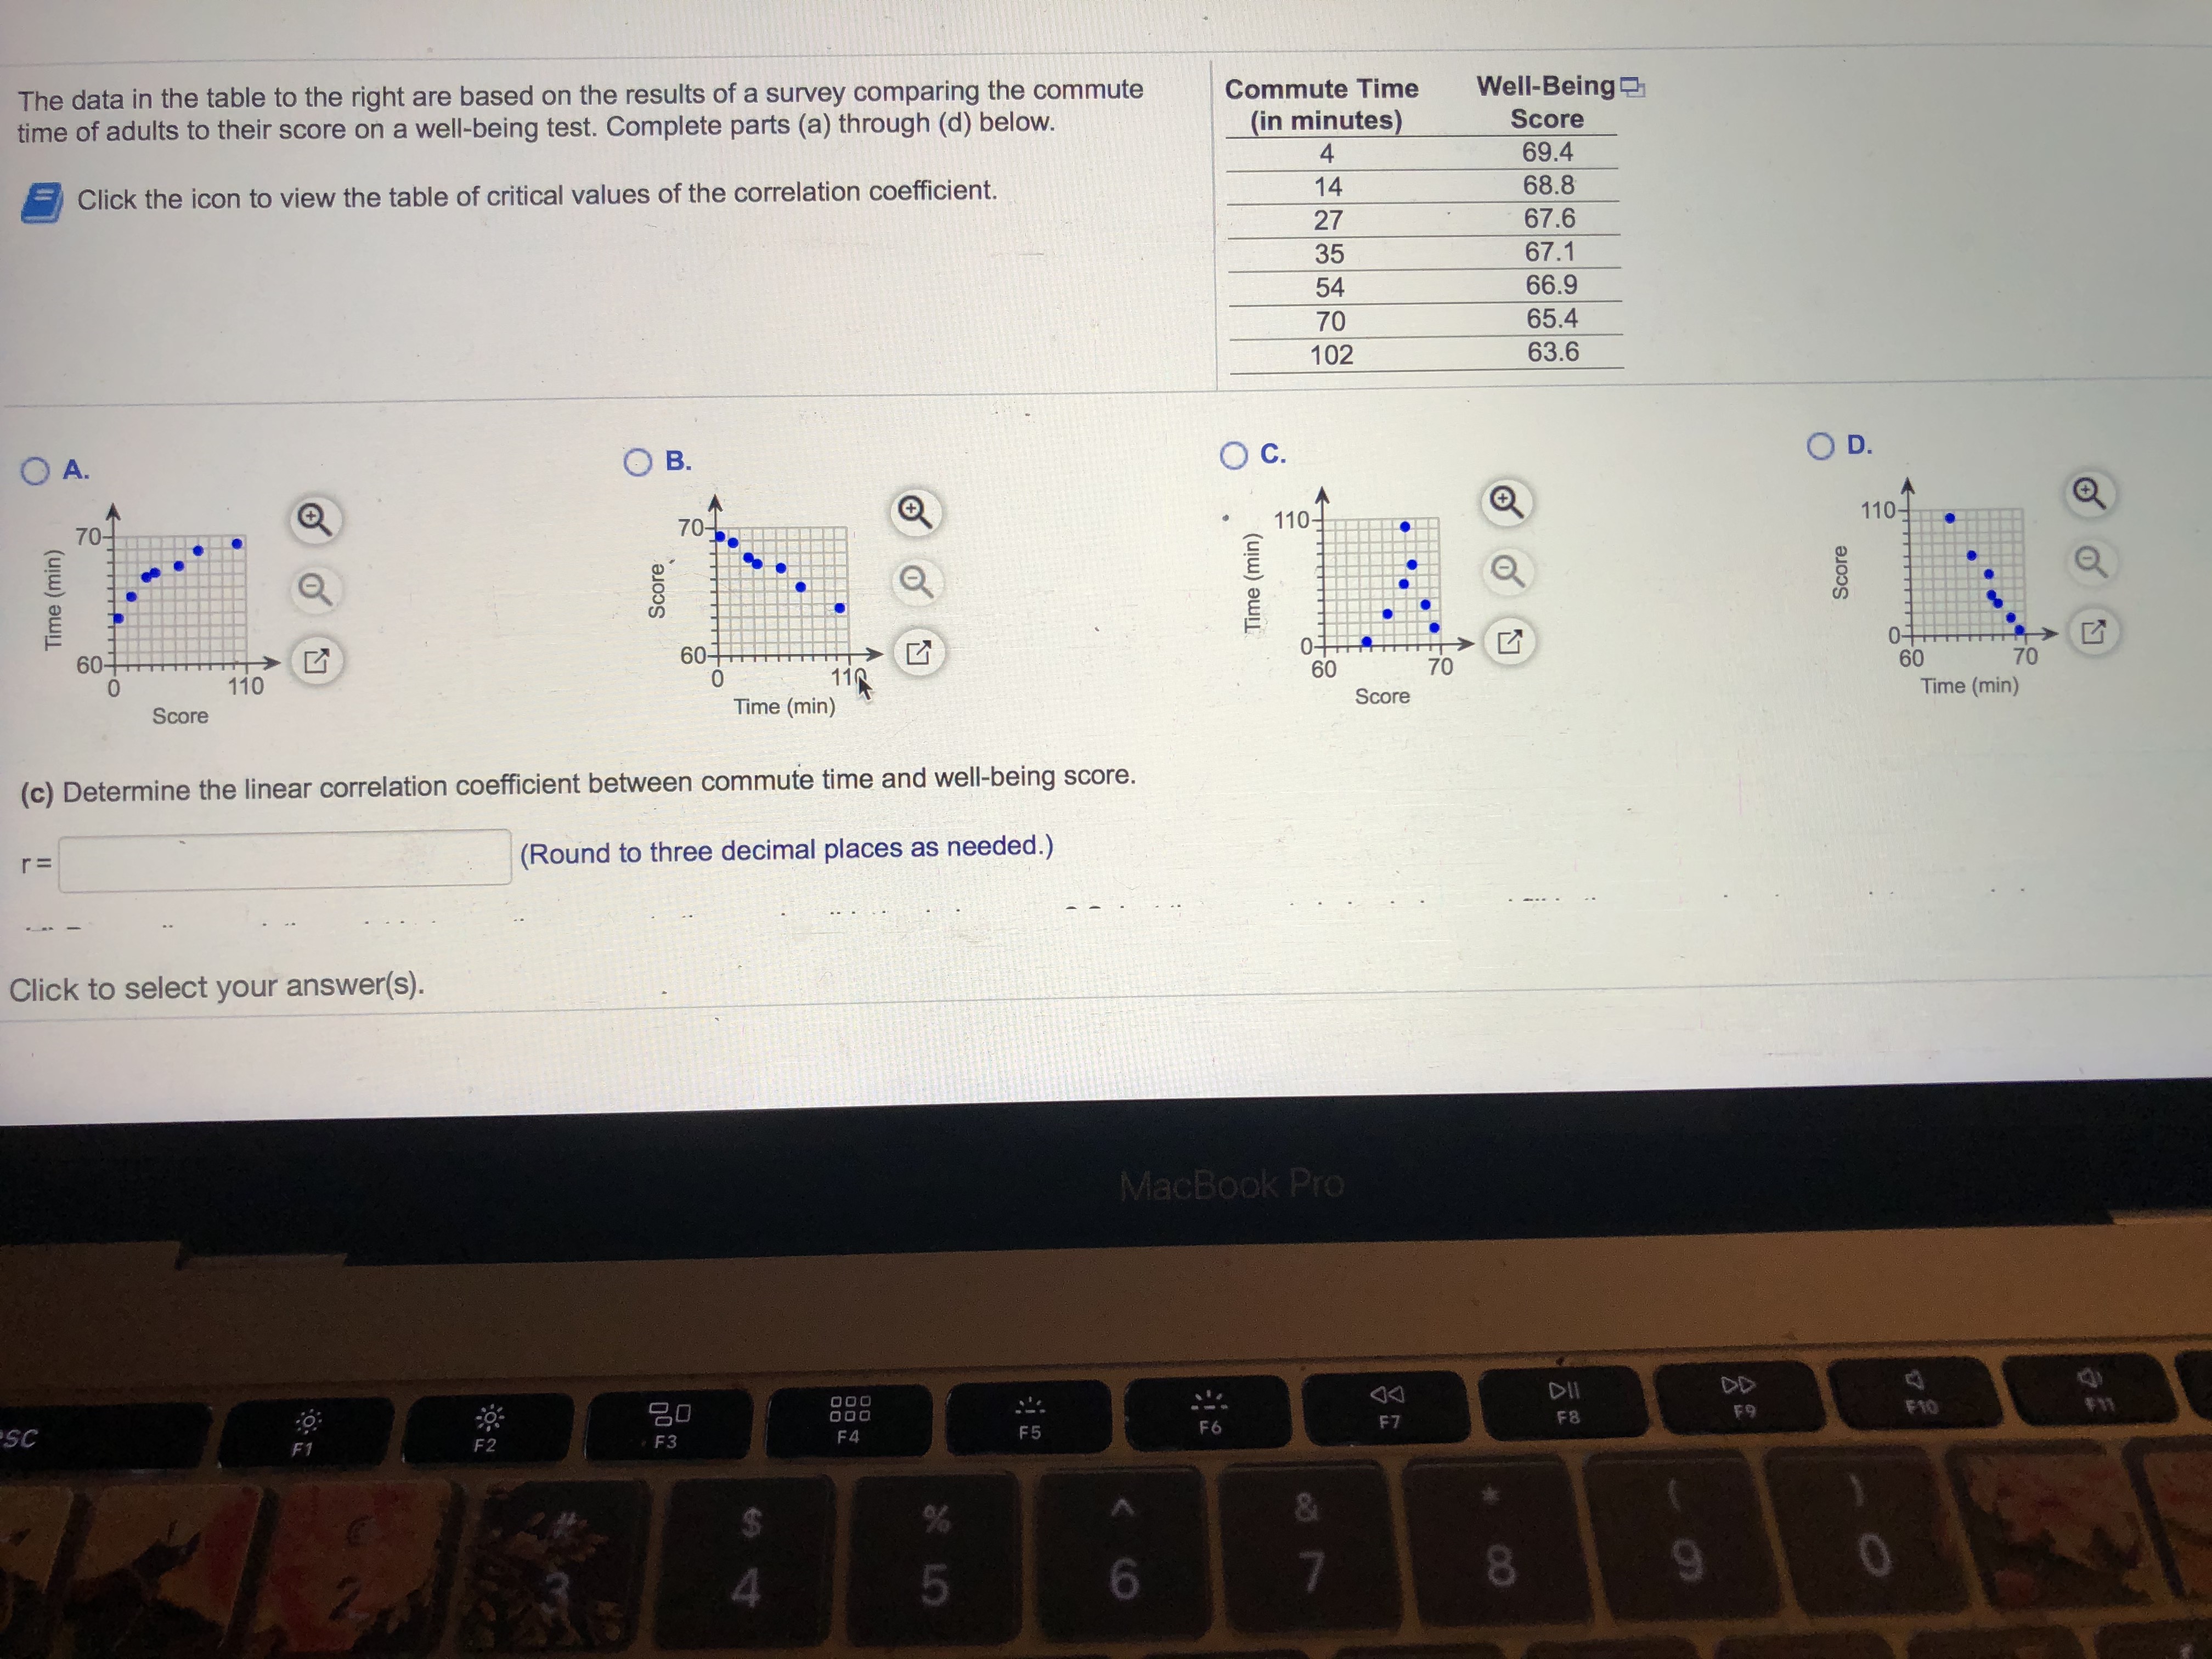
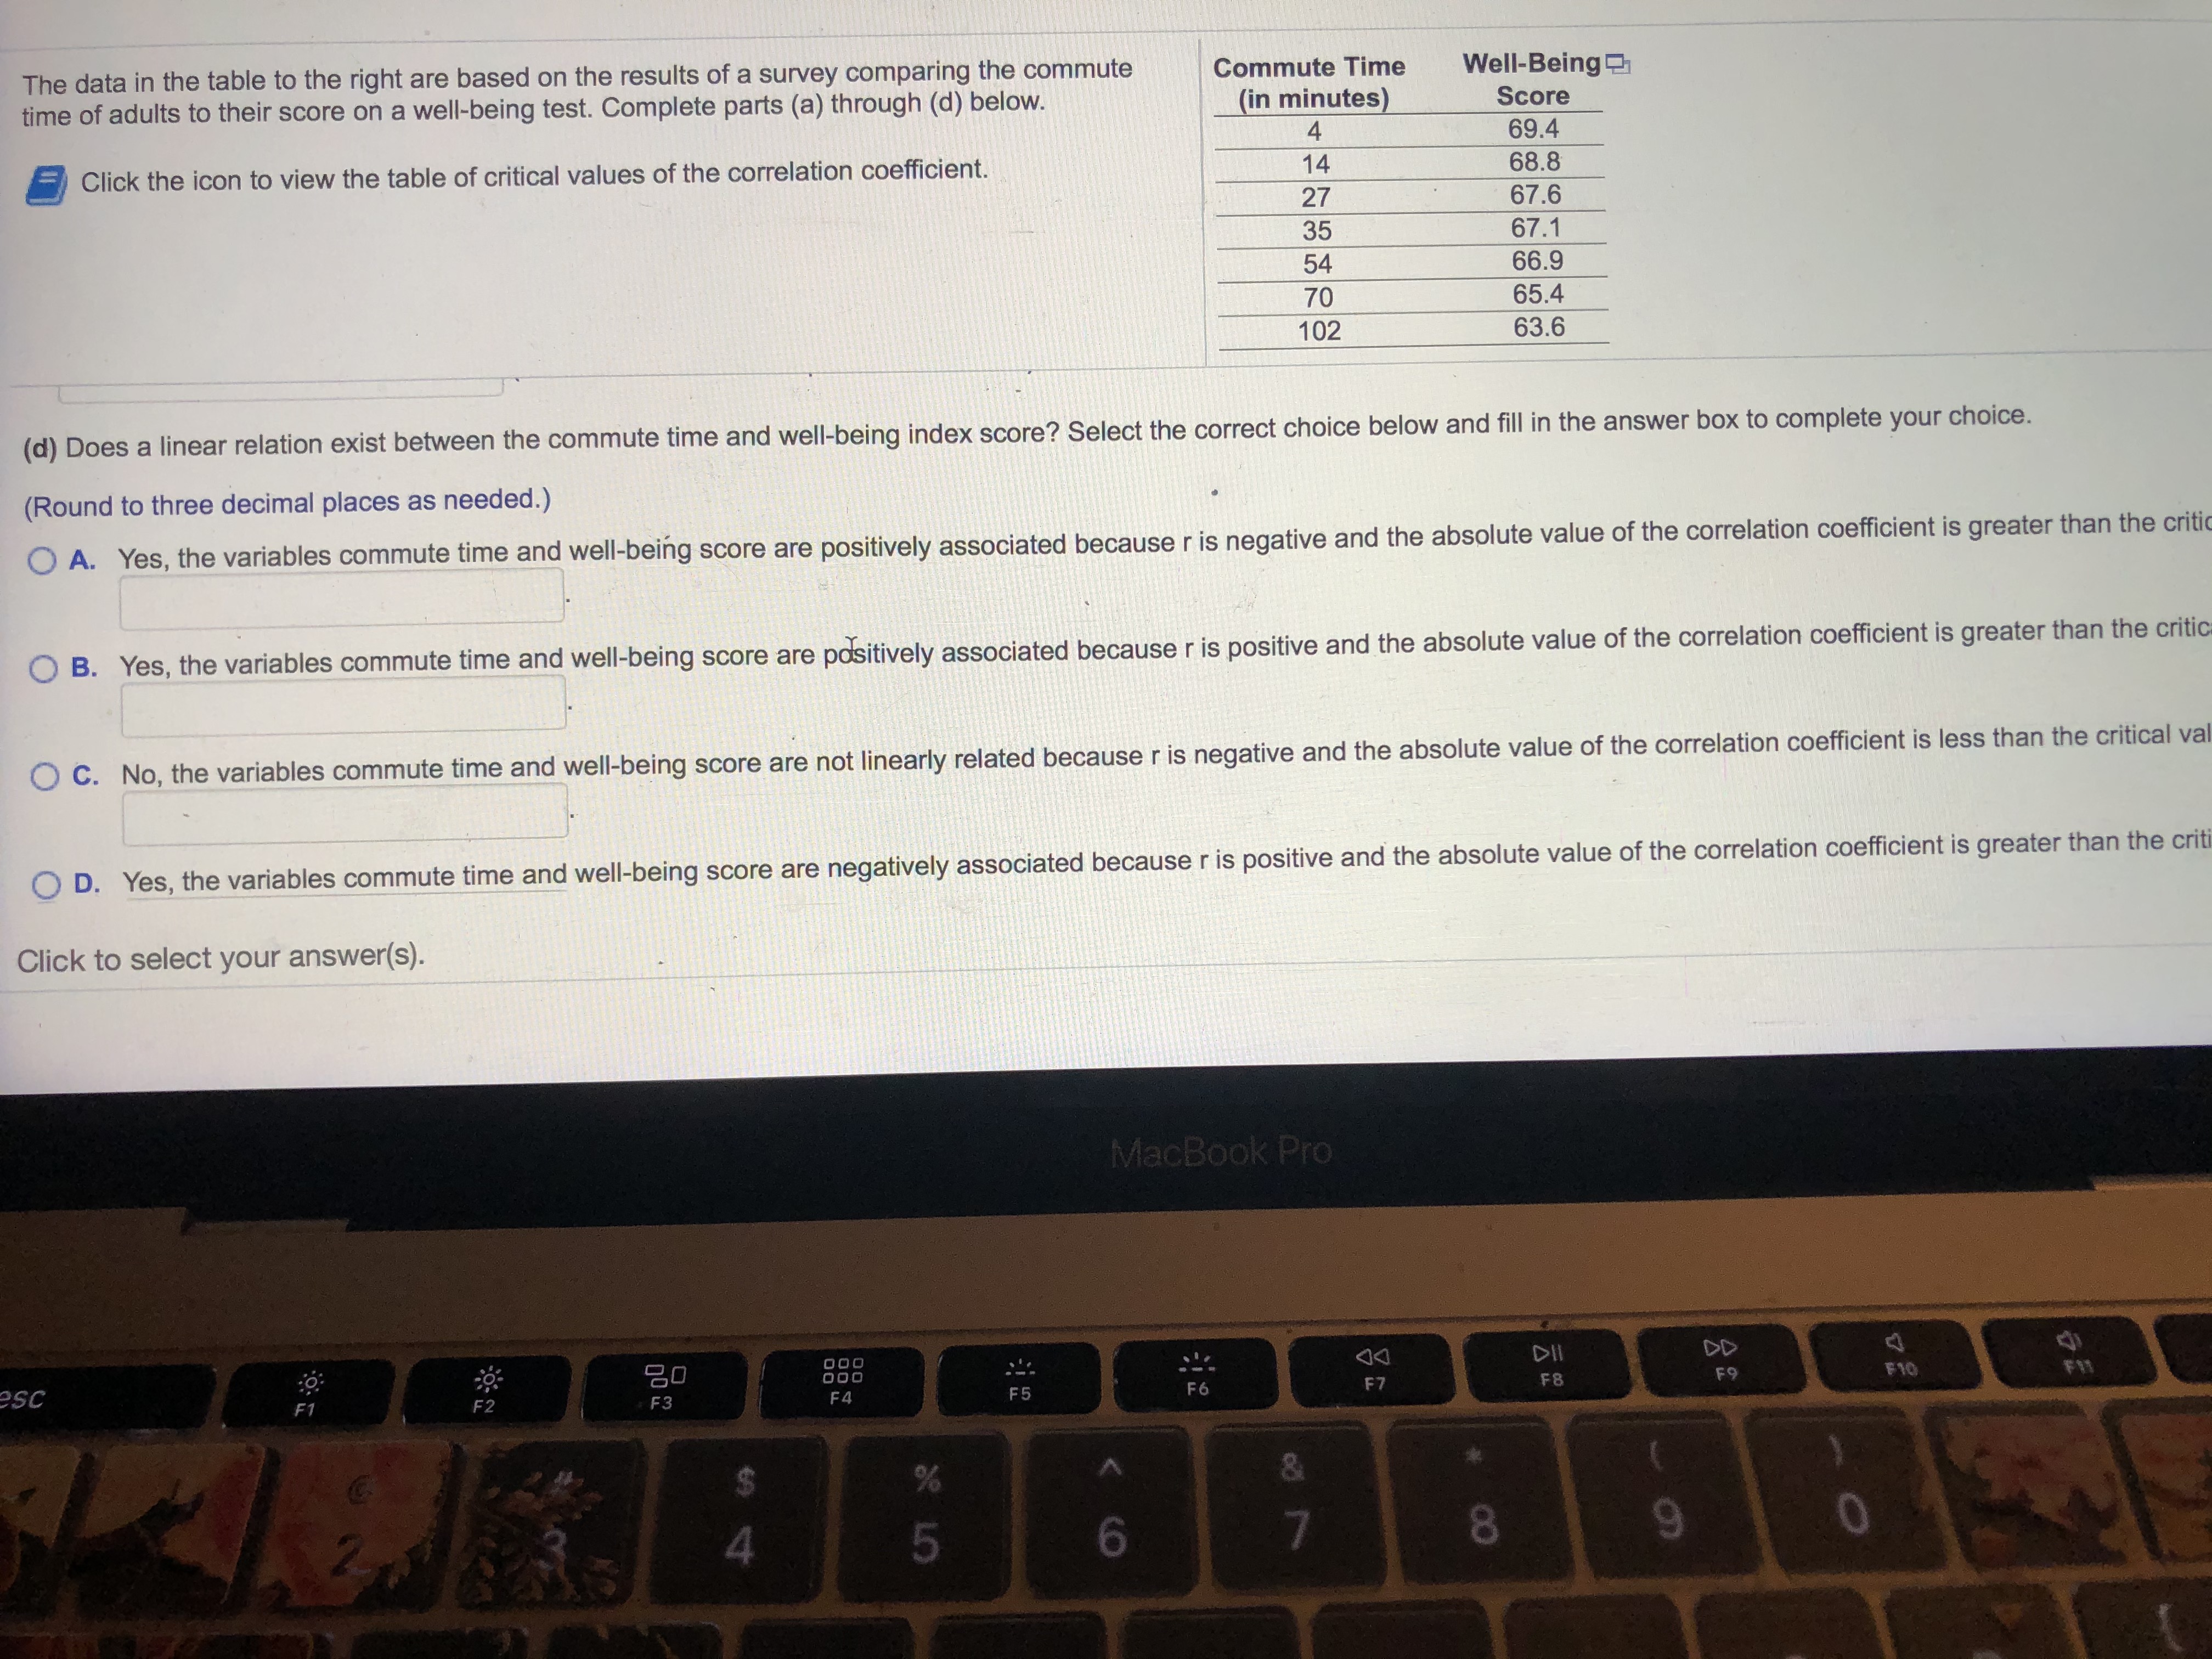
The data in the table to the right are based on the results of a survey comparing the commute Commute Time Well-Being time of adults to their score on a well-being test. Complete parts (a) through (d) below. (in minutes) Score 4 69.4 Click the icon to view the table of critical values of the correlation coefficient. 14 68.8 27 67.6 35 67.1 54 66.9 70 65.4 102 63.6 O A. O B. O c. OD. 70- 70- 110- 110 Score Time (min) Score Time (min) 60 70 60 70 110 110 Score Time (min) Score Time (min) (c) Determine the linear correlation coefficient between commute time and well-being score. r = (Round to three decimal places as needed.) Click to select your answer(s). MacBook Pro DII DD 20 F6 F7 F9 F10 SC F3 F4 F5 OThe data in the table to the right are based on the results of a survey comparing the commute Commute Time Well-Being time of adults to their score on a well-being test. Complete parts (a) through (d) below. (in minutes) Score 4 69.4 Click the icon to view the table of critical values of the correlation coefficient. 14 68.8 27 67.6 35 67.1 54 66.9 70 65.4 102 63.6 (d) Does a linear relation exist between the commute time and well-being index score? Select the correct choice below and fill in the answer box to complete your choice. (Round to three decimal places as needed.) O A. Yes, the variables commute time and well-being score are positively associated because r is negative and the absolute value of the correlation coefficient is greater than the criti B. Yes, the variables commute time and well-being score are positively associated because r is positive and the absolute value of the correlation coefficient is greater than the critic C. No, the variables commute time and well-being score are not linearly related because r is negative and the absolute value of the correlation coefficient is less than the critical val O D. Yes, the variables commute time and well-being score are negatively associated because r is positive and the absolute value of the correlation coefficient is greater than the cri Click to select your answer(s). MacBook Pro DD esc FO F 10 F1 F3 F5 F6 F7 0 5This Question: 2 pts 17 of 28 (9 complete) This Test: 60 pts possible Several years ago, 47% of parents who had children in grades K-12 were satisfied with the quality of education the students receive. A recent poll asked 1, 115 parents who have children in grades K-12 if they were satisfied with the quality of education the students receive. Of the 1,115 surveyed, 459 indicated that they were satisfied. Construct a 90% confidence interval to assess whether this represents evidence that parents' attitudes toward the quality of education have changed. What are the null and alternative hypotheses? Ho: p = 0.47 versus Hy : p $ 0.47 (Type integers or decimals rounded to two decimal places as needed.) Use technology to find the 90% confidence interval. We are 90% confident the proportion of parents who had children in grades K-12 that were satisfied with the quality of education the students receive is between and (Type integers or decimals rounded to two decimal places as needed.) What is the correct conclusion? A. Since the interval does not contain the proportion stated in the null hypothesis, there is insufficient evidence that parents' attitudes toward the quality of education have changed. O B. Since the interval contains the proportion stated in the null hypothesis, there is sufficient evidence that parents' attitudes toward the quality of education have changed. O C. Since the interval does not contain the proportion stated in the null hypothesis, there is sufficient evidence that parents' attitudes toward the quality of education have changed. D. Since the interval contains the proportion stated in the null hypothesis, there is insufficient evidence that parents' attitudes toward the quality of education have changed. Click to select your answer(s). perajdwoo vonpondde MacBook Pro esc