Answered step by step
Verified Expert Solution
Question
1 Approved Answer
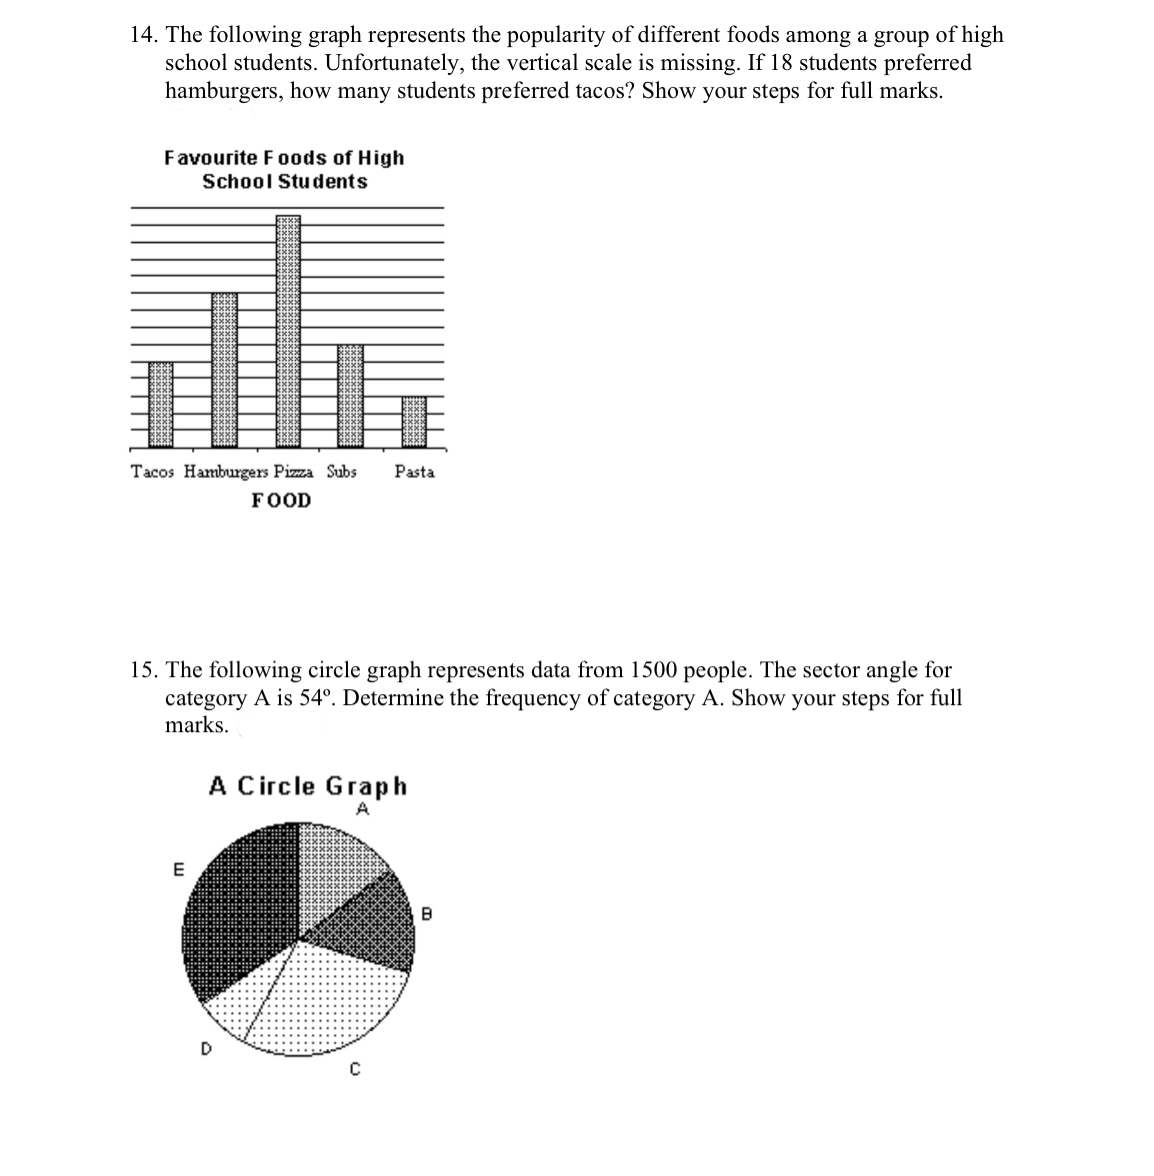
14. The following graph represents the popularity of different foods among a group of high school students. Unfortunately, the vertical scale is missing. If


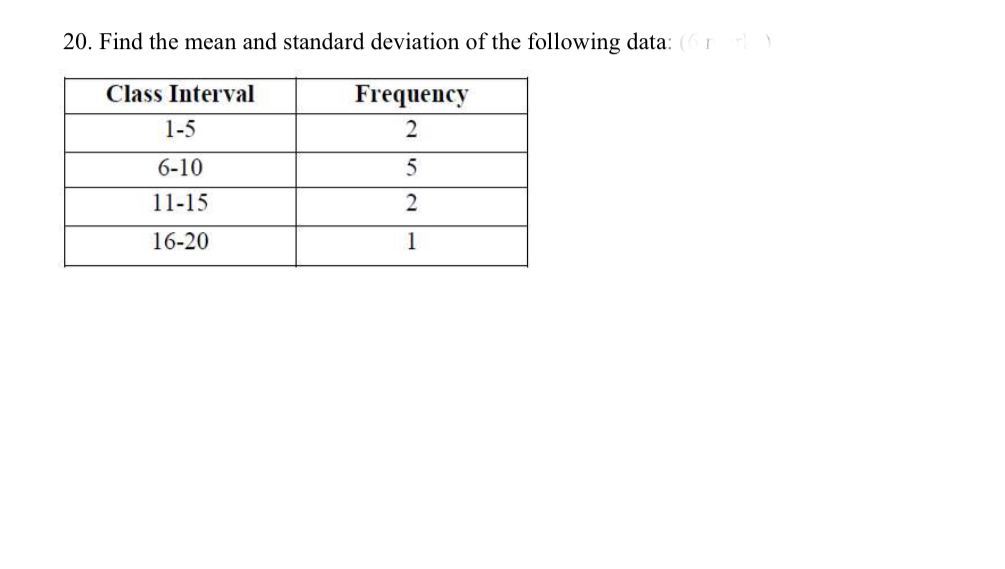
14. The following graph represents the popularity of different foods among a group of high school students. Unfortunately, the vertical scale is missing. If 18 students preferred hamburgers, how many students preferred tacos? Show your steps for full marks. Favourite Foods of High School Students kxxx 6999 **** kxxx kxxx CODE kxx: xxx KXX 0001 COO kxxx 8888 Tacos Hamburgers Pizza Subs Pastal FOOD 15. The following circle graph represents data from 1500 people. The sector angle for category A is 54. Determine the frequency of category A. Show your steps for full marks. A Circle Graph A E C B 20. Find the mean and standard deviation of the following data: (6 rark) Class Interval Frequency 1-5 2 6-10 5 11-15 2 16-20 1
Step by Step Solution
There are 3 Steps involved in it
Step: 1
14 Without the vertical scale we cannot determine the exact number of students who preferred tacos The graph only provides a relative comparison of th...
Get Instant Access to Expert-Tailored Solutions
See step-by-step solutions with expert insights and AI powered tools for academic success
Step: 2

Step: 3

Ace Your Homework with AI
Get the answers you need in no time with our AI-driven, step-by-step assistance
Get Started


