Answered step by step
Verified Expert Solution
Question
1 Approved Answer
14:125:305 Numerical Modeling in Biomedical Systems Name Worksheet 3 Due Friday March 9th SUBMIT THIS COMPLETED WORKSHEET SUBMIT YOUR CODE THROUGH THE SAKAI WEBSITE YOU
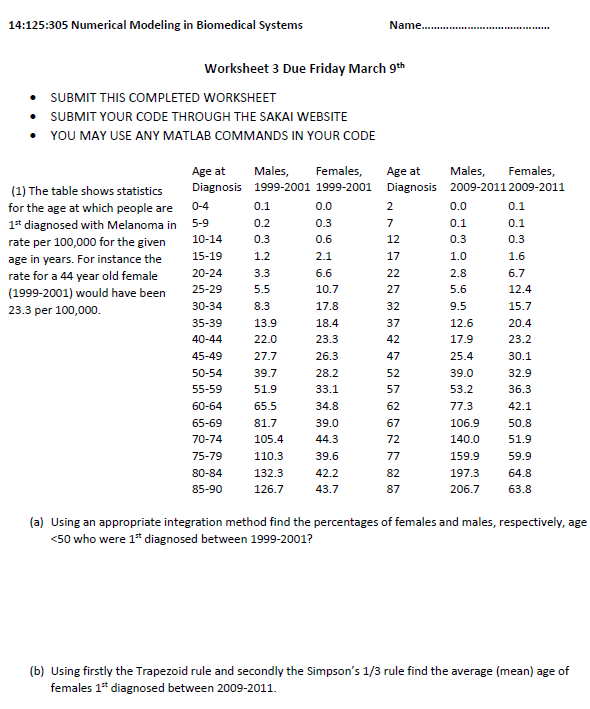
14:125:305 Numerical Modeling in Biomedical Systems Name Worksheet 3 Due Friday March 9th SUBMIT THIS COMPLETED WORKSHEET SUBMIT YOUR CODE THROUGH THE SAKAI WEBSITE YOU MAY USE ANY MATLAB COMMANDS IN YOUR CODE tes, Females, Age at Diagnosis 1999-2001 1999-2001 Diagnosis 2009-2011 2009-2011 Males, Females, (1) The table shows statistics for the age at which people are 0-4 1t diagnosed with Melanoma in 5-9 rate per 100,000 for the given age in years. For instance the rate for a 44 year old female (1999-2001) would have been 23.3 per 100,000 0.1 0.2 0.3 1.2 3.3 0.0 0.0 12 17 0.3 1.0 0.3 10-14 15-19 20-24 25-29 6.6 10.7 17.8 18.4 23.3 26.3 28.2 33.1 34.8 39.0 44.3 39.6 42.2 43.7 6.7 30-34 35-39 40-44 45-49 50-54 55-59 60-64 65-69 70-74 75-79 80-84 85-90 13.9 22.0 27.7 39.7 51.9 65.5 81.7 105.4 110.3 132.3 126.7 27 32 37 42 47 52 57 9.5 12.6 17.9 25.4 39.0 53.2 77.3 12.4 15.7 20.4 23.2 30.1 32.9 36.3 42.1 106.950.8 140.0 51.9 159.9 59.9 197.3 64.8 206.7 63.8 67 72 82 87 (a) Using an appropriate integration method find the percentages of females and males, respectively, age
Step by Step Solution
There are 3 Steps involved in it
Step: 1
Get Instant Access to Expert-Tailored Solutions
See step-by-step solutions with expert insights and AI powered tools for academic success
Step: 2
Step: 3
Ace Your Homework with AI
Get the answers you need in no time with our AI-driven, step-by-step assistance
Get Started